filmov
tv
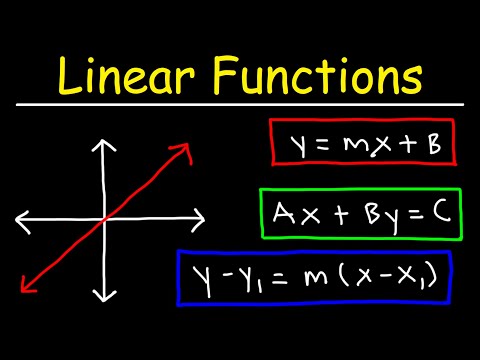
Graphing Linear Functions in Standard Form | HS.F.IF.C.7 🖤

Показать описание
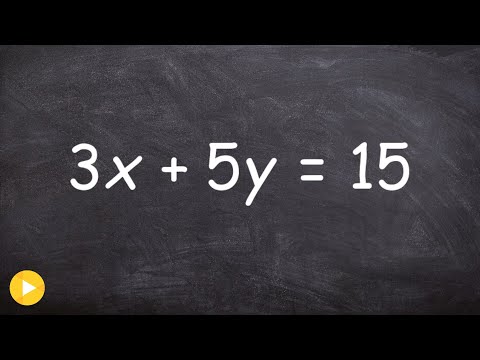
In this video lesson we will learn how to graph a linear function in standard form using the x and y intercepts. We will discover that standard form is Ax + By = C where A, B, and C MUST all be integers - meaning they cannot be fractions or decimals. We will also learn that both A and B cannot be equal to zero, however, if either A or B is zero, this will result either a horizontal line or a vertical line. We will learn that horizontal lines cross the y-axis, have a y-intercept, and are written in the form y=b where b represents the y-intercept. We will learn that vertical lines cross the x-axis, have an x-intercept, and are written in the form x=a where a represents the x-intercept. We will also learn how to find the x and y-intercepts of a linear function written in standard form. We will discover that if we evalute the equation for y=0 or find the solution (a, 0) we will find the x-intercept. Then, we will learn that if we evaluate the equation for x=0 or find the solution (0, b) we will find the y-intercept. Since we will have found two solutions or points on the linear function, we can graph the linear function using the intercepts. We will also graph a real world linear function and interpret the x and y intercepts relative to the given situation. Student practice problems are embedded in the lesson and include modeled exemplar solutions.
#algebra
#standardform
#graphlinearfunctions
#findintercepts
#findxintercept
#findyintercept
#interpretintercepts
00:00 Introduction
00:40 Understanding Standard Form
01:28 Horizontal Lines
02:25 Vertical Lines
03:14 Graphing Horizontal & Vertical Lines
03:56 Student Practice #1
04:48 Finding x- and y-intercept to Graph
07:01 Student Practice #2
08:29 Real World Standard Form Function
09:32 Student Practice #3
11:35 Interpret the x and y intercepts
Common Core Math Standards
HS.A.CED.A.2 Create equations in two or more variables to represent relationships between quantities; graph equations on coordinate axes with labels and scales.
Analyze functions using different representations.
HS.F.IF.C.7 Graph functions expressed symbolically and show key features of the graph, by hand in simple cases and using technology for more complicated cases.*
HS.F.IF.C.7.A Graph linear and quadratic functions and show intercepts, maxima, and minima.
 0:04:47
 0:15:01
 0:13:24
 0:04:53
 0:03:40
 0:13:10
 0:05:33
 0:08:06
 1:49:04
 0:12:45
 0:27:52
 0:10:45
 0:01:55
 0:03:46
 0:32:05
 0:02:40
 0:06:52
 0:10:52
 0:07:14
 0:04:31
 0:03:23
 0:03:58
 0:03:48
 0:10:05