filmov
tv
Mean and standard deviation versus median and IQR | AP Statistics | Khan Academy
Показать описание
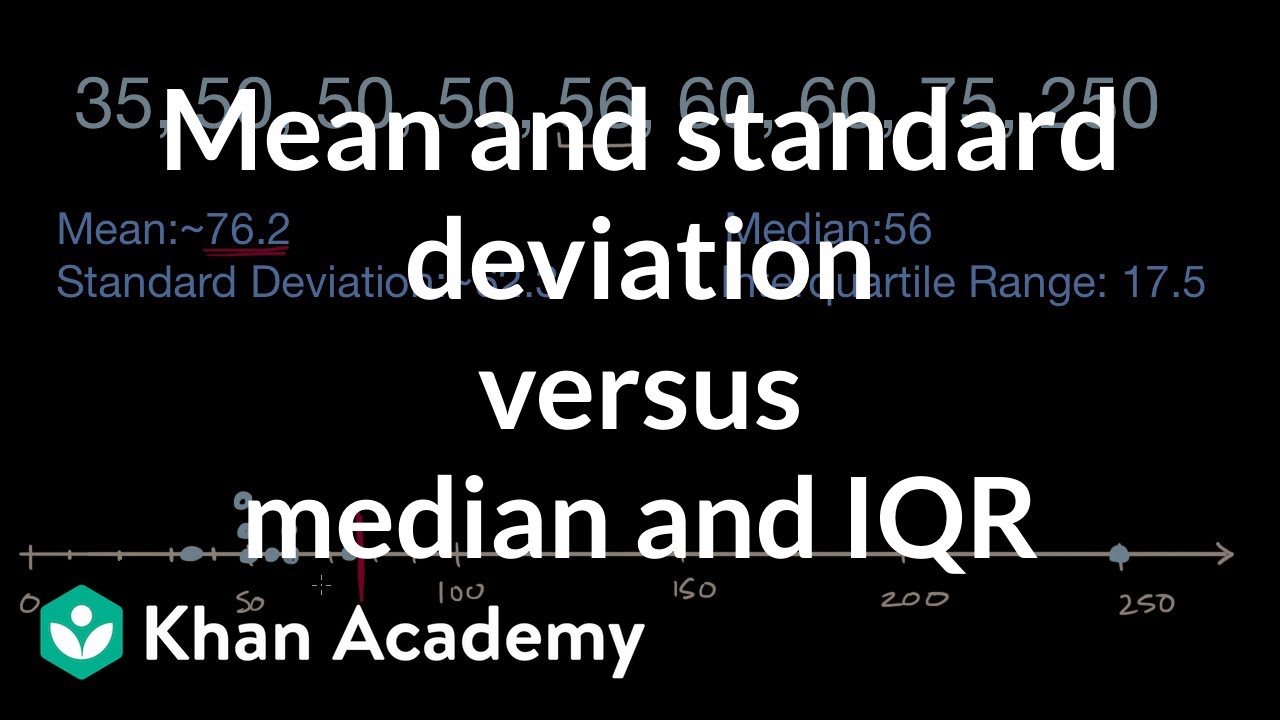
Learn to choose the "preferred" measures of center and spread when outliers are present in a set of data.
AP Statistics on Khan Academy: Meet one of our writers for AP¨_ Statistics, Jeff. A former high school teacher for 10 years in Kalamazoo, Michigan, Jeff taught Algebra 1, Geometry, Algebra 2, Introductory Statistics, and AP¨_ Statistics. Today he's hard at work creating new exercises and articles for AP¨_ Statistics.
Khan Academy is a nonprofit organization with the mission of providing a free, world-class education for anyone, anywhere. We offer quizzes, questions, instructional videos, and articles on a range of academic subjects, including math, biology, chemistry, physics, history, economics, finance, grammar, preschool learning, and more. We provide teachers with tools and data so they can help their students develop the skills, habits, and mindsets for success in school and beyond. Khan Academy has been translated into dozens of languages, and 15 million people around the globe learn on Khan Academy every month. As a 501(c)(3) nonprofit organization, we would love your help! Donate or volunteer today!
 0:01:47
The Standard Deviation (and Variance) Explained in One Minute: From Concept to Definition & Form...
 0:07:58
Mean and standard deviation versus median and IQR | AP Statistics | Khan Academy
 0:08:16
What is Standard Deviation and Mean Absolute Deviation | Math, Statistics for data science, ML
 0:07:49
Standard deviation (simply explained)
 0:14:22
Calculating the Mean, Variance and Standard Deviation, Clearly Explained!!!
 0:07:10
Mode, Median, Mean, Range, and Standard Deviation (1.3)
 0:05:50
Standard Deviation and Variance
 0:13:47
Variance and Standard Deviation: Why divide by n-1?
 0:29:27
Project152 Week 20 Solutions
 0:10:39
Standard Deviation and Standard Error of the Mean
 0:10:21
Standard Deviation Formula, Statistics, Variance, Sample and Population Mean
 0:09:30
Measures of Variability (Range, Standard Deviation, Variance)
 0:05:59
Variance - Clearly Explained (How To Calculate Variance)
 0:04:16
Adding Vs. Multiplying Effect on Median and Standard Deviation
 0:14:56
Standard deviation, standard error of the mean, & confidence intervals
 0:04:56
STATISTICS- Variance and Standard Devation
 0:12:34
Range, variance and standard deviation as measures of dispersion | Khan Academy
 0:00:45
SPSS - Mean, Median, Mode, Standard Deviation & Range
 0:07:14
How To Calculate The Standard Deviation
 0:47:50
Standard Deviation & Mean Absolute Deviation Explained - 6-8-19]
 0:05:47
Making a chart with means and standard deviations
 0:05:17
Standard Deviation ( Sigma )
 0:03:16
What Are And How To Calculate Z Scores - Z Score Statistics Formula Explained
 0:05:38
Why You SHOULD Know MAD vs Sample Standard Deviation
Комментарии