filmov
tv
Variance - Clearly Explained (How To Calculate Variance)

Показать описание
In this video, I’m going to clearly explain what variance is in statistics. I will also show you how to calculate variance by using a very simple example.
VIDEO CHAPTERS
00:00 Intro
00:14 Definition of variance
00:28 How to calculate variance (example)
03:19 Calculating standard deviation from variance
03:54 Plotting the standard deviation
04:36 Variance for sample vs population
05:34 Summary
HOW I CREATED THIS TUTORIAL (AFFILIATE LINKS)
Software (Microsoft PowerPoint 365 ProPlus)
FOLLOW US
AFFILIATE DISCLAIMER
Some of the above links are affiliate links, meaning I will earn a commission if a sale is made after clicking on the link
 0:05:59
Variance - Clearly Explained (How To Calculate Variance)
 0:01:47
The Standard Deviation (and Variance) Explained in One Minute: From Concept to Definition & Form...
 0:14:22
Calculating the Mean, Variance and Standard Deviation, Clearly Explained!!!
 0:08:28
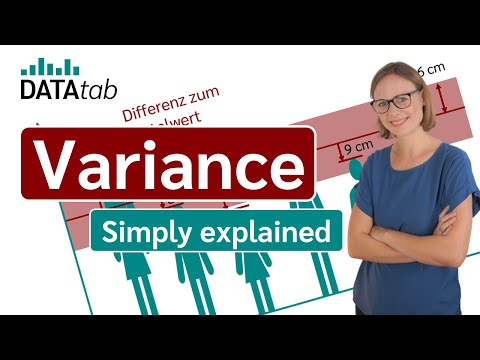
Variance (Simply explained)
 0:05:37
Variance, Clearly explained !
 0:07:47
Covariance Clearly Explained!
 0:22:23
Covariance, Clearly Explained!!!
 0:06:36
Machine Learning Fundamentals: Bias and Variance
 0:05:13
The Normal Distribution, Clearly Explained!!!
 0:01:04
The Bell Curve (Normal/Gaussian Distribution) Explained in One Minute: From Definition to Examples
 0:09:30
Measures of Variability (Range, Standard Deviation, Variance)
 0:13:39
Expected Values, Main Ideas!!!
 0:22:00
12 - Analysis of Variance (ANOVA) Overview in Statistics - Learn ANOVA and How it Works.
 0:11:38
Using Linear Models for t-tests and ANOVA, Clearly Explained!!!
 0:05:23
How To Calculate The Standard Deviation - Clearly Explained!
 0:19:13
Pearson's Correlation, Clearly Explained!!!
 0:10:24
How To Calculate Variance
 0:05:48
Standardization vs Normalization Clearly Explained!
 0:03:22
What is variance? | Use of variance | How to calculate variance? variance in statistics
 0:11:38
Using Linear Models for t tests and ANOVA, Clearly Explained!!!
 0:08:28
Variance: A simple explanation. Part 1
 0:03:41
How To Calculate Variance In Excel (Sample And Population!)
 0:02:48
How To Calculate The Sample Variance | Introduction to Statistics
 0:05:50
Standard Deviation and Variance
Комментарии