filmov
tv
Multiple Linear Regression in R | R Tutorial 5.3 | MarinStatsLectures
Показать описание
In this R video lecture you will learn to use "lm", "summary", "cor", "confint" functions among others. You will also learn to use "plot" function for producing residual and QQ plots in R.
◼︎ Table of Content:
0:00:07 Multiple Linear Regression Model
0:00:32 How to fit a linear model in R? using the "lm" function
0:00:36 How to access the help menu in R for multiple linear regression
0:01:06 How to fit a linear regression model in R with two explanatory or X variables
0:01:19 How to produce and interpret the summary of linear regression model fit in R
0:03:16 How to calculate Pearson's correlation between the two variables with R
0:03:26 How to interpret the collinearity between two variables in R
0:03:49 How to create a confidence interval for the model coefficients in R? using the "confint" function
0:03:57 How to interpret the confidence interval for our model's coefficients in R
0:04:13 How to fit a linear model using all of the X variables in R
0:04:27 how to check the linear regression model assumptions in R? by examining plots of the residuals or errors using the "plot(model)" function
►► Watch More:
This video is a tutorial for programming in R Statistical Software for beginners, using RStudio.
Follow MarinStatsLectures
Our Team:
Content Creator: Mike Marin (B.Sc., MSc.) Senior Instructor at UBC.
Producer and Creative Manager: Ladan Hamadani (B.Sc., BA., MPH)
These videos are created by #marinstatslectures to support some courses at The University of British Columbia (UBC) (#IntroductoryStatistics and #RVideoTutorials for Health Science Research), although we make all videos available to the everyone everywhere for free.
Thanks for watching! Have fun and remember that statistics is almost as beautiful as a unicorn!
 0:05:19
Multiple Linear Regression in R | R Tutorial 5.3 | MarinStatsLectures
 0:07:43
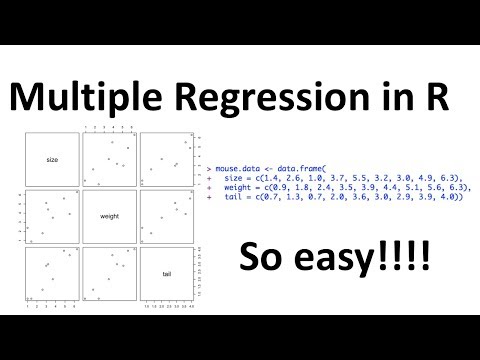
Multiple Regression in R, Step by Step!!!
 0:21:37
Multiple lineare Regression in R [ALL IN ONE] - Voraussetzungen, Durchführung und Interpretation
 0:14:37
Schritt für Schritt - Multiple lineare Regression in R rechnen und interpretieren
 0:07:43
Multiple Regression in R, Step-by-Step!!!
 0:13:12
Multiple linear regression in R
 0:05:45
Multiple Linear Regression Using R
 0:13:36
Multiple Linear Regression in R Studio R Statistics
 0:11:41
7.2 Multiple Linear Regression in R
 0:20:48
Multivariable Linear Regression in R: Everything You Need to Know!
 0:09:26
Multiple regression in R: example
 0:33:49
Multiple linear regression using R studio (Aug 2022)
 0:11:01
How To... Create a Multiple Linear Regression Model in R #101
 0:45:18
Multiple Linear Regression in R
 0:09:48
Multiple linear regression with interaction in R
 0:33:07
Multiple Regression from beginning to end in 30 minutes.
 0:16:10
Multiple Linear Regression in R
 0:05:30
R Tutorial: Multiple Linear Regression
 0:08:11
How To... Make a Prediction using a Multiple Linear Regression Model in R #102
 0:09:57
Quick tutorial on how to run Multiple regression in R
 0:25:28
Multiple Linear Regression using R ( All about it )
 0:05:01
Linear Regression in R, Step by Step
 0:28:40
Adding variables to your multiple regression model
 0:10:46
Multiple regression: how to select variables for your model
Комментарии