filmov
tv
Tree Diagrams | Statistics & Probability | Maths | FuseSchool

Показать описание
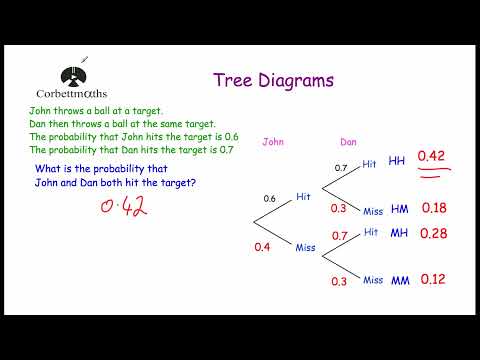
In this video we are going to look at how to use a Tree Diagram. A tree diagram shows all the possible outcomes of more than one event by following the possible paths along the branches of the tree. Tree diagrams utilise the “and” and “or” rules of probability for multiple events
There are two types of tree diagrams, for two types of situations: Dependent and Independent. Dependent tree diagrams occur when the second probability is affected by the first. For example, if a coloured counter is chosen and not replaced, the second probability is changed. Independent probabilities are completely separate from each other and so the second choice remains the same, no matter the first. These types of tree diagrams are often easier for this reason.
CREDITS
Animation & Design:
Narration:
Script:
VISIT US
 0:32:52
Probability Tree Diagrams
 0:10:44
Conditional probability tree diagram example | Probability | AP Statistics | Khan Academy
 0:16:32
Probability Tree Diagrams - GCSE Maths
 0:06:02
Tree Diagrams | Statistics & Probability | Maths | FuseSchool
 0:04:29
Probability : Tree Diagrams
 0:02:49
Tree diagram probability examples,
 0:11:08
Tree Diagrams - Corbettmaths
 0:04:31
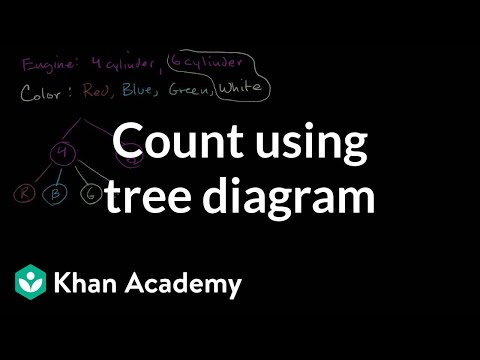
Count outcomes using tree diagram | Statistics and probability | 7th grade | Khan Academy
 0:03:19
Probability Tree Diagrams : removing items without replacement
 0:16:59
Introduction to Probability, Basic Overview - Sample Space, & Tree Diagrams
 0:19:14
Bayes' Theorem of Probability With Tree Diagrams & Venn Diagrams
 0:07:58
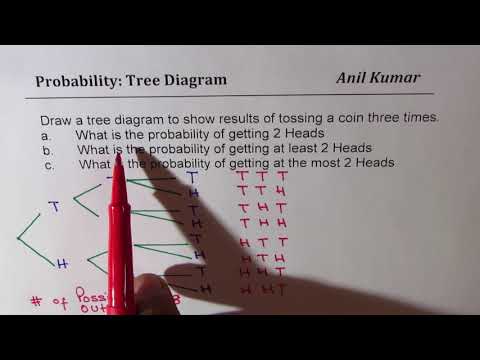
Probability Tossing Three Coins Tree Diagram At Least 2 Heads
 0:25:56
Introduction to Probability/Tree diagram
 0:07:43
Tree Diagrams (Probability) [IB Math AI SL/HL]
 0:12:18
Probability Tree Diagrams
 0:05:36
Tree Diagrams Explained!
 0:07:38
CCSS Math - Probability Example 3 (Tree Diagram)
 0:48:07
Probability - Everything you need to know | Tree diagrams | Venn diagrams | Contingency tables
 0:07:36
Probability Trees (1 of 2: How to construct them)
 0:19:48
4-PROBABILITY TREE DIAGRAMS
 0:00:24
probability #maths #mathematics #venndiagram #probability #math #gcsemaths
 0:03:39
Tree Diagram Grade 11 Exam
 0:17:08
The Maths Prof: Tree Diagrams
 0:09:07
NCEA Level 1, 2 and 3 Statistics - Probability Tree Diagrams and Calculations.
Комментарии