filmov
tv
Python Tutorial: Geometries and shapefiles

Показать описание
---
Now that you've plotted points that show where the Nashville chickens are, lets see if we can get even more insight by plotting some polygonal data.
You can visualize point data on a map more effectively if you plot meaningful regions to give context to the points.
One way to do this is with a shapefile. A shapefile stores a geometry field that is used to draw a map.
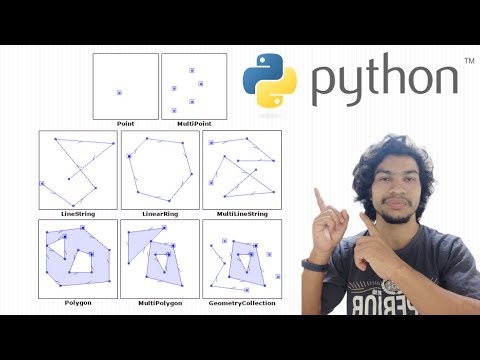
There are three basic kinds of geometry: point (a single longitude/latitude pair), line (two or more longitude/latitude pairs that can be connected to form a continuous segment) and polygon (made up of three or more longitude/latitude pairs that are joined in a specified order to create an enclosed region).
A shapefile can be recognized by its .shp file extension. The Dot-SHP file is usually provided for download in a zip file along with other files. The DOT-SHP file must be in a directory along with a DOT-SHX file and a DOT-DBF file in order to work. These files need to have the same filename prefix.
The DOT-SHP file contains the geometry, the DOT-DBF file holds attributes for each geometry, and the DOT-SHX or shape index file helps link the attributes to the shapes.
The geopandas package provides a library for working with geospatial data. You can read in a shapefile with the geopandas read_file() function.
GeoDataFrames are a type of data structure that can be created with the geopandas library. Geopandas provides many of the same methods for GeoDataFrames that the pandas package provides for DataFrames. One example of this is the .head() function.
The shapefile we’ll be using next is composed of two polygons – one for the general services district and another for the urban services district.
The Nashville service district that is closest to the city center is called the urban services district. People who live there pay more taxes and get more services - like trash and recycling collection, fire and police protection, street lights, and more. The general services district is made up of Nashville suburbs. Residents of the general services district pay lower property taxes and get fewer services in return.
This is the geometry object from the first row in the service districts GeoDataFrame.
If you are working in a jupyter notebook, you can look at a geometry object by calling it with loc or iloc. The loc[] accessor locates a specific data point when you pass the row name and column name to it. The iloc[] accessor locates a specific data point by using the given row index and column index.
You can also print a geometry by wrapping the call to loc or iloc with the print function. Printing the geometry gives you all the longitude/latitude pairs that define the polygon, with each pair separated by a comma. Only the first 25 points of this polygon are shown here. Polygon geometries can be quite large!
Plotting a geodataframe is as easy as calling
geodataframe dot plot.
Here we have plotted a geodataframe of school districts.
We can make it more informative by coloring each region according to some column in the geodataframe.
Here we have used the 'district' column. Setting the legend to 'True' creates a legend to help interpret the colors.
Now it's time for you to use geopandas and a shapefile to plot the Nashville service districts.
#PythonTutorial #DataCamp #Visualizing #Geospatial #Data #Python #Geometries #shapefiles
 0:04:01
Python Tutorial: Geometries and shapefiles
 0:06:37
Python tutorial geometries and shapefiles
 0:10:11
Creating geometries - shapely | python | GeoDev
 0:26:09
How to use GeoDjango (import GIS shapefile with Python)
 0:13:48
Tutorial to convert geospatial data (Shapefile) to 3D data (VTK) with Python, Geopandas & Pyvist...
 0:15:54
GDAL tutorial : plot shapefile and attribute table with GDAL in python
 0:54:01
Shapefile, GeoJSON & KML (vector) data handling with Python and osgeo (GDAL)
 0:13:53
Split Shapefile using python | GIS Development
 0:48:42
An Absolute Beginner's Guide to Python GeoPandas
 0:04:41
Python Tutorial: Introduction to GeoPandas
 0:12:43
Python GIS - Open, Display and Plot Shapefiles with Geopandas in Google Colab
 0:16:13
How to split a shapefile into several shapefiles using python
 0:13:30
How to create a point/line/polygon shapefile with Python and Fiona - Tutorial
 0:03:11
python create shapefile
 0:09:56
Coding Geometry using python | practical tutorial
 0:15:15
7 - How to Create a Shapefile with Fiona, Shapely and Python
 0:01:58
GIS: How can I import shapefile in python? (2 Solutions!!)
 0:21:56
QGIS Python 05 Clip Raster with a Multi-feature Shapefile
 0:04:01
GIS: Creating square grid polygon shapefile with Python? (3 Solutions!!)
 0:16:50
Read and write vector files with GDAL/OGR in Python
 0:01:21
GIS: Writing shapefile of multiple geometry using Python
 0:01:18
GIS: Read only geometry from shapefile with python/geopandas
 0:07:42
PySHP - Reader Shapefile Python
 1:25:33
Day 1 - Working with shapefiles in Python | Introduction to Fiona and Shapely
Комментарии