filmov
tv
Creating a revenue retention chart from a transaction log

Показать описание
In this video, I show how to convert a raw transaction log into a chart showing sales by acquisition cohort as a function of the months since that cohort was acquired, as a percentage of month 0 revenue. This is also known as the revenue retention chart.
 0:08:35
Creating a revenue retention chart from a transaction log
 0:17:50
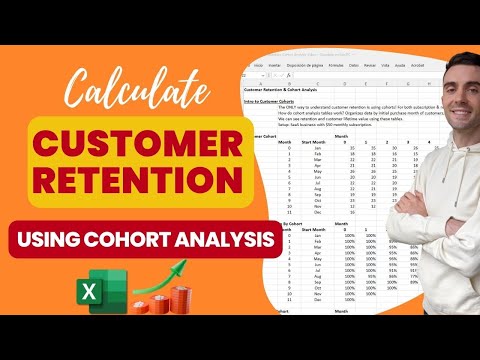
Customer Retention & Cohort Analysis | How VCs Calculate Customer Retention
 0:05:20
#Tableau - Calculate Customer Retention & Cohort Analysis
 0:05:29
Cohort Analysis in Excel
 0:10:53
What is Cohort Analysis? || Retention Rate || Data Analysis || Dynamic Array Formulas
 0:01:02
4 things about Net Revenue Retention | Calqulate Academy
 0:08:55
Retention Analysis - A Practical Spreadsheet Example #saas
 0:16:17
Cohort Analysis on Customer Retention in Excel
 2:05:44
09.10.24 Board Briefing
 0:05:29
Net Dollar Retention Using Cohort Analysis | Eric Andrews Clips
 0:01:40
SaaS / Software Key Performance Indicators (KPIs) - Gross Revenue Retention
 0:11:39
Retention and Revenue Reporting in SaaS Analytics Stack Part 4
 0:00:33
I created a free calculator for net dollar retention rate and cohort analysis - steal it!
 0:01:56
Net Revenue Retention
 0:06:14
Net Revenue Retention Rate | Gorgias's Beginner's Guide to KPIs & Metrics | Part 4/6
 0:03:13
Google Analytics Tutorial - Cohort analysis for user retention
 0:10:48
Calculate Retention & Churn || Cohort Analysis || Data Analysis
 0:01:30
How to calculate Net Retention Rate (NRR) correctly
 0:01:58
SaaS / Software Key Performance Indicators (KPIs) - Net Revenue Retention
 0:58:15
Cohort Analysis with Elizabeth Yin (Jun 2020)
 0:18:59
How to Crush Churn and Maximize Revenue Retention
 0:42:24
Customer Cohort and Retention Analysis | How to Calculate Retention Rate
 0:00:45
Essential #CS metrics: what is net revenue retention (NRR)?
 0:04:13
𝐂𝐚𝐥𝐜𝐮𝐥𝐚𝐭𝐢𝐨𝐧 of Customer Retention Rate in Power BI (DAX)
Комментарии