filmov
tv
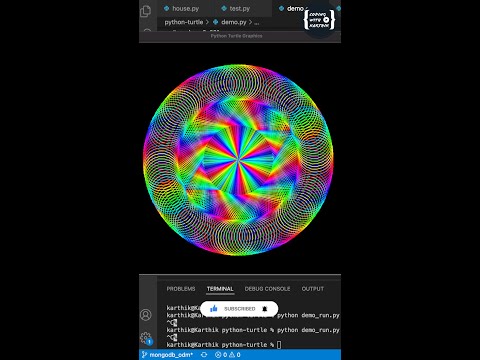
Python code to draw a Normal Curve. Turtle cursor allows to see a speed variation during the drawing

Показать описание
Normal Distribution represents several nature behaviors.
I have spent the last 20 years studying and teaching about statistics distribution applied in continuous improvement methodologies and I have never realized the speed aspect related to probabilities regions of the curve.
In the center of the curve we have more samples (68% between 1 sd from the mean) and less samples at the extremities. This points concentration affects the turtle cursor behavior due there are more points to draw in the center of curve (low speed).
Usually we see a final curve drawing. With turtle library we can see the process of creation during the drawing.
This aspect don't change the interpretation of the curve but is, at least, interesting to shows.
Turtle Graphics is a simple python library that works like a pen in a sheet.
Python is a powerful languages applied in several areas like science, statistics, machine learning, etc.
Song: NIVIRO - The Floor Is Lava [NCS Release]
Music provided by NoCopyrightSounds
 0:02:16
 0:01:00
 0:00:56
 0:00:59
 0:00:59
 0:05:04
 0:39:29
 0:00:16
 0:02:57
 0:23:44
 0:00:25
 0:00:28
 0:00:41
 0:00:19
 0:00:55
 0:05:57
 0:01:00
 0:00:15
 0:00:47
 0:00:31
 0:43:01
 0:00:57
 0:00:58
 0:00:54