filmov
tv
Checking the Normality Assumption in Multiple Regression with Excel 2007

Показать описание
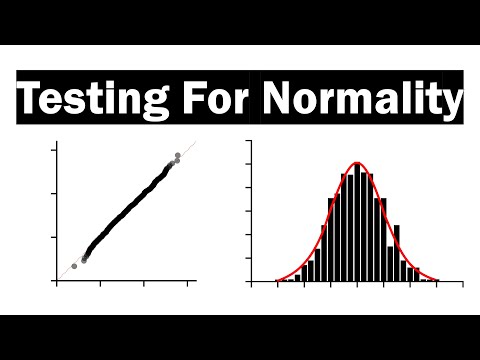
For our inference procedures (t-test, F-tests, confidence intervals, prediction intervals) of multiple regression to be accurate, we assume the population errors come from a normal curve. Thus, if our residuals look like they come from a normal curve, we believe the population errors do, too. Make a dotplot of standardized residuals if you have fairly small sample sizes (say less than 40 observations), and make a histogram of standardized residuals if you have sample sizes that are large (say at least 40). The more mound-shaped the distribution, the more faith we have that the points came from a normal curve.
 0:09:56
 0:03:31
 0:12:16
 0:07:52
 0:00:12
 0:04:44
 0:09:03
 0:07:54
 0:04:31
 0:07:13
 0:01:53
 0:01:51
 0:04:50
 0:08:04
 0:01:38
 0:06:07
 0:12:43
 0:02:50
 0:01:51
 0:01:50
 0:04:57
 0:02:26
 0:02:23
 0:17:09