filmov
tv
Is this data Normally Distributed? Methods for Checking for Normality

Показать описание
We examine the weights for 50 strawberries to determine if the weights are approximately Normally distributed. First, we look at a histogram of the data and confirm it is unimodal and roughly symmetric. Next, we use the empirical rule (the 68-95-99.7 Rule) to see if about 68% of the weights fall within one standard deviation. Finally, we use a normal probability plot on a TI-84 Plus C Silver Edition.
 0:05:13
The Normal Distribution, Clearly Explained!!!
 0:04:50
Is this data Normally Distributed? Methods for Checking for Normality
 0:07:52
Normality test [Simply Explained]
 0:01:52
Is my data normally distributed? | SPSS
 0:10:59
Normal Distribution EXPLAINED with Examples
 0:03:16
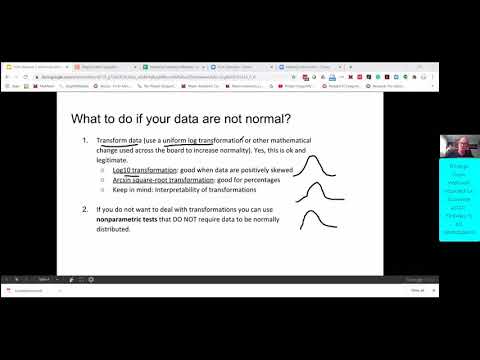
What to do if data is not normally distributed
 0:05:30
Checking that data is normally distributed using Excel
 0:06:44
Log normal distribution | Math, Statistics for data science, machine learning
 1:14:06
Class 11: Generalized Measurement Models (Lecture 04a, part 1, Bayesian Psychometric Models, F2024)
 0:09:56
Testing For Normality - Clearly Explained
 0:00:56
What is a Normal Distribution? #datascience #statistics
 0:11:23
The Shape of Data: Distributions: Crash Course Statistics #7
 0:06:32
Checking that data is normally distributed using R
 0:22:54
Is my data Normally Distributed? Probably not! Statistics, qqplots, and Histograms.
 0:18:47
Correcting data problem: Non Normal Distribution to Normal Distribution
![[IB Math] How](https://i.ytimg.com/vi/oOVhHjER4EU/hqdefault.jpg) 0:47:00
0:47:00
[IB Math] How do I tell if my data is normally distributed?
 0:51:03
Standard Normal Distribution Tables, Z Scores, Probability & Empirical Rule - Stats
 0:10:06
Non-Normal Distribution in Statistics – Skewness and Kurtosis (3-9)
 0:05:21
Normal Distribution: Calculating Probabilities/Areas (z-table)
 0:29:30
Normal Distribution & Probability Problems
 0:14:08
z-Score, z-Standardization, Standard Normal Distribution, z-Distribution Table - Simply explained
 0:07:39
Understanding the normal distribution - statistics help #Statistics #Probability
 0:06:57
Z-Scores, Standardization, and the Standard Normal Distribution (5.3)
 0:06:55
How to Plot a Normal Distribution (Bell Curve) in Excel – with Shading!
Комментарии