filmov
tv
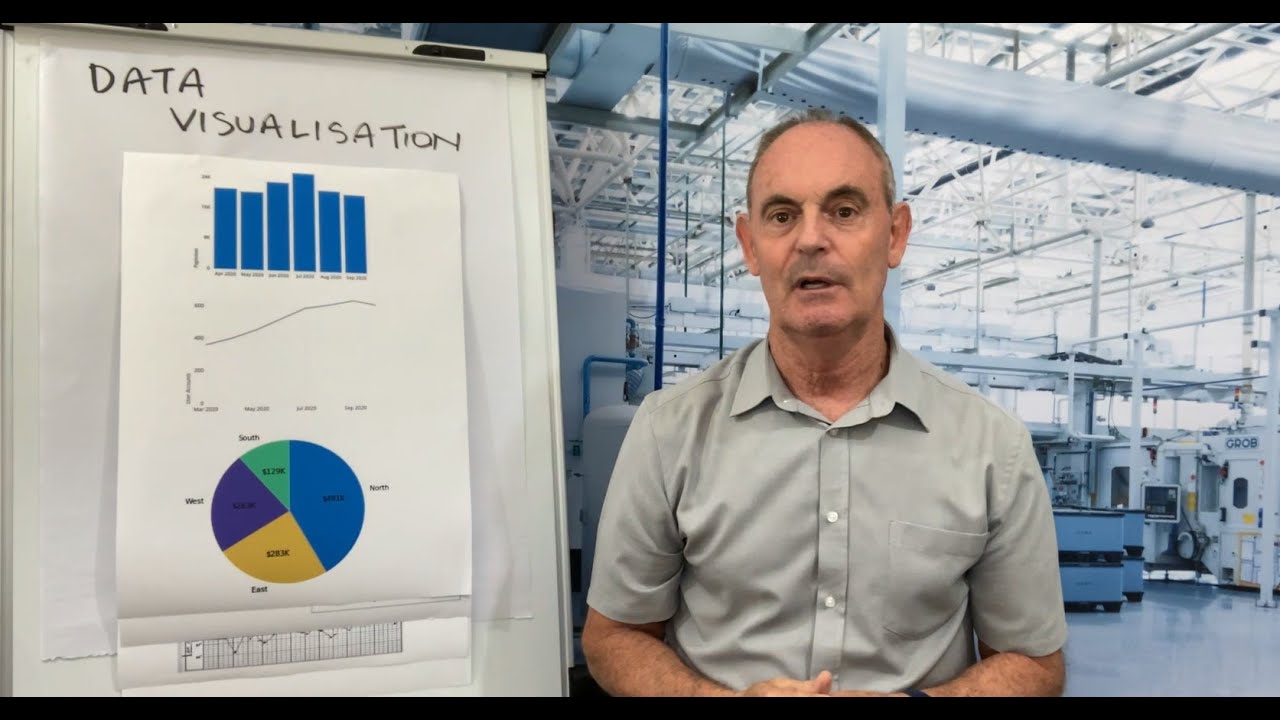
LEAN BITES: DATA VISUALISATION
Показать описание
A "bite sized" explanation of a principle that I’ve been coaching around getting the best out of displaying data.
Along the LEAN journey, being able to use data to communicate a clear message is a critical skill.
Charts or Graphs can visually explain complex problems, strengthen your position of persuasion and help to deliver key directions.
The key is to present data in a clearly and simple format, without over complicating the message. A more complex display can easily lose the audience or deliver a clouded message.
This principle has helped me strengthen the effectiveness of displaying data which I’m sure you’ll find this demonstration very helpful.
 0:07:50
 0:04:29
 0:02:07
 0:44:22
 0:02:21
 0:04:51
 0:00:31
 0:20:54
 0:49:13
 1:20:32
 0:38:56
 0:28:10
 1:40:56
 0:08:59
 0:25:51
 0:01:36
 0:14:20
 0:07:54
 1:03:25
 0:25:07
 0:49:12
 0:07:29
 0:59:44
 0:55:36