filmov
tv
Probability Distributions A-Z! | Normal vs. Standard Normal vs. Poisson vs. Binomial vs. Bernoulli

Показать описание
In this video, we will illustrate the difference between Normal, Standard Normal, Poisson, Bernoulli and Binomial distributions.
NORMAL DISTRIBUTION
A normal distribution is known as the bell curve because it looks like a bell!
Normal distribution is defined by its mean and standard deviation.
Normal distribution is centered about its mean, with standard deviation indicating its spread.
STANDARD NORMAL DISTRIBUTION
The Standard Normal distribution curve has:
Mean = 0
Standard deviation = 1
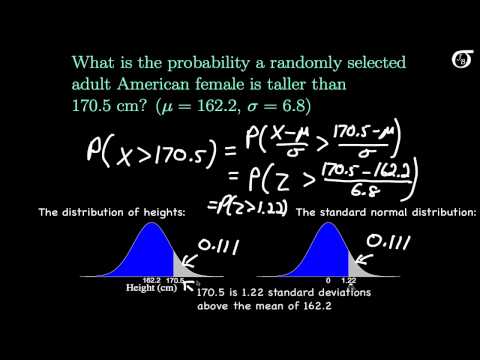
We can convert data that is normally distributed to make it follow a standard normal by subtracting the mean and dividing by the standard deviation.
For normally distributed data:
- 68.3% of observations are within 1 standard deviation from the mean (-1,1).
- 95% of observations are within 2 standard deviations of the mean (-2,2).
- 99.7% of observations are within 3 standard deviations of the mean, interval (-3,3).
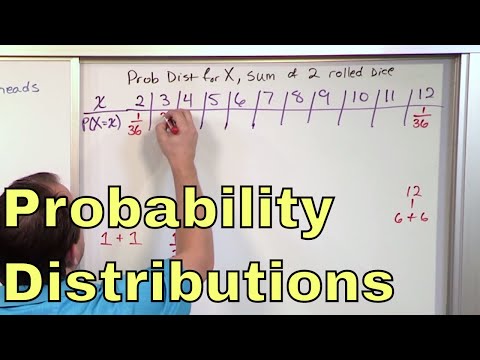
POISSON DISTRIBUTION
Poisson distribution is the discrete probability distribution of the number of events that occur in a specified period of time.
Poisson distribution is extremely helpful for planning purposes as it enable managers to analyze customer behavior as they visit a restaurant or store for example.
BINOMIAL DISTRIBUTION
A binomial distribution measures the probability of success or failure outcome when the experiment is repeated several times (ex: outcomes of taking the AWS Machine Learning exam is: pass or fail).
There are only two possible outcomes with fixed probabilities summing to one.
For example, a coin toss has only two possible outcomes: heads or tails where the probability of each event is exactly = 0.5.
BERNOULLI DISTRIBUTION
Bernoulli distribution is a special case of the binomial distribution for n = 1.
Simply put, it is a binomial distribution with a single trial (one coin toss).
Bernoulli distribution is a discrete probability distribution has only two outcomes (“Success” or a “Failure”).
For example, when coin flipping:
Probability of head (success) = 0.5
Probability of tail (failure) = 1 – P = 0.5
The probability of a failure is labeled on the x-axis as 0 and success is labeled as 1.
I hope you guys enjoyed this video and found it useful and informative.
Please subscribe to my channel for more videos!
Thanks,
Ryan
#Distributions #NormalDistribution #Bernoulli #Binomial #poisson
NORMAL DISTRIBUTION
A normal distribution is known as the bell curve because it looks like a bell!
Normal distribution is defined by its mean and standard deviation.
Normal distribution is centered about its mean, with standard deviation indicating its spread.
STANDARD NORMAL DISTRIBUTION
The Standard Normal distribution curve has:
Mean = 0
Standard deviation = 1
We can convert data that is normally distributed to make it follow a standard normal by subtracting the mean and dividing by the standard deviation.
For normally distributed data:
- 68.3% of observations are within 1 standard deviation from the mean (-1,1).
- 95% of observations are within 2 standard deviations of the mean (-2,2).
- 99.7% of observations are within 3 standard deviations of the mean, interval (-3,3).
POISSON DISTRIBUTION
Poisson distribution is the discrete probability distribution of the number of events that occur in a specified period of time.
Poisson distribution is extremely helpful for planning purposes as it enable managers to analyze customer behavior as they visit a restaurant or store for example.
BINOMIAL DISTRIBUTION
A binomial distribution measures the probability of success or failure outcome when the experiment is repeated several times (ex: outcomes of taking the AWS Machine Learning exam is: pass or fail).
There are only two possible outcomes with fixed probabilities summing to one.
For example, a coin toss has only two possible outcomes: heads or tails where the probability of each event is exactly = 0.5.
BERNOULLI DISTRIBUTION
Bernoulli distribution is a special case of the binomial distribution for n = 1.
Simply put, it is a binomial distribution with a single trial (one coin toss).
Bernoulli distribution is a discrete probability distribution has only two outcomes (“Success” or a “Failure”).
For example, when coin flipping:
Probability of head (success) = 0.5
Probability of tail (failure) = 1 – P = 0.5
The probability of a failure is labeled on the x-axis as 0 and success is labeled as 1.
I hope you guys enjoyed this video and found it useful and informative.
Please subscribe to my channel for more videos!
Thanks,
Ryan
#Distributions #NormalDistribution #Bernoulli #Binomial #poisson
 0:05:21
Normal Distribution: Calculating Probabilities/Areas (z-table)
 0:10:13
Probability Distributions A-Z! | Normal vs. Standard Normal vs. Poisson vs. Binomial vs. Bernoulli
 0:51:03
Standard Normal Distribution Tables, Z Scores, Probability & Empirical Rule - Stats
 0:10:59
Normal Distribution EXPLAINED with Examples
 0:05:13
The Normal Distribution, Clearly Explained!!!
 0:29:30
Normal Distribution & Probability Problems
 0:20:27
03 - The Normal Probability Distribution
 0:06:57
Z-Scores, Standardization, and the Standard Normal Distribution (5.3)
 0:04:51
Normal Distribution: Find Probabilities Given Z-scores Using Table (Left of Z-score)
 0:12:11
Intro to the Normal Distribution and how to Calculate Probability
 0:07:09
Finding Areas Under And What Is The Standard Normal Distribution Curve And Z Scores Explained
 0:15:32
Normal Probability Distribution 1
 0:29:54
02 - Random Variables and Discrete Probability Distributions
 0:08:50
The Normal Distribution and the 68-95-99.7 Rule (5.2)
 0:05:27
An Introduction to the Normal Distribution
 0:07:48
ck12.org normal distribution problems: z-score | Probability and Statistics | Khan Academy
 0:12:35
What is Normal Distribution in Statistics ? How to solve Normal (Gaussian) distribution problems ?
 0:16:39
Normal Distribution Word Problems
 0:19:07
Intro to Standard Z-Score & Normal Distribution in Statistics
 0:10:28
Standardizing Normally Distributed Random Variables
 0:13:32
Area Under the Normal Probability Distribution - Statistics Lecture to Learn the Normal Distribution
 0:00:51
To calculate probability from value of z on calculator
 0:13:16
Normal Distribution and Z Score Table / Probability Distribution
 0:05:24
The Normal Distribution - The concept of a z value [Year 2 Maths (Stats)]
Комментарии