filmov
tv
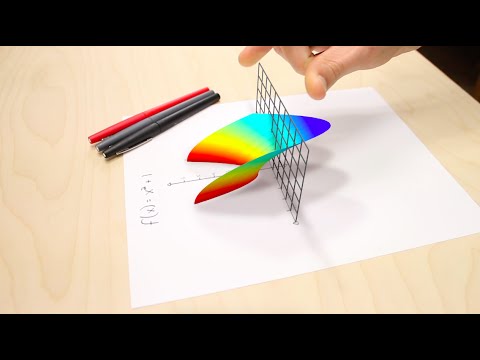
Visualization of Complex Functions: the Exponential Y = e ^ X

Показать описание
For Y = y1 + i y2 and X = x1 + i x2, the function Y = Y(X) is a 4D surface in space (X,Y) ~ (x1, x2, y1, y2). Let us project this "simply" unto our 2D screen ...
 0:14:32
The 5 ways to visualize complex functions | Essence of complex analysis #3
 0:05:47
Imaginary Numbers Are Real [Part 1: Introduction]
 0:07:17
Visualization of Complex Functions in 3D
 0:03:40
Visualization of Complex Functions: the 'selfpower function' Y = X ^ X
 0:22:11
But what is the Riemann zeta function? Visualizing analytic continuation
 0:02:29
Visualization of Complex Functions: exploring the 'Quadsinq' (my name:-)
 0:02:47
Visualization of Complex Functions: the Tangent Y = tan X
 0:01:52
Visualization of complex Functions: exploring the 'Quadosinuoid' (my name:-)
 0:04:08
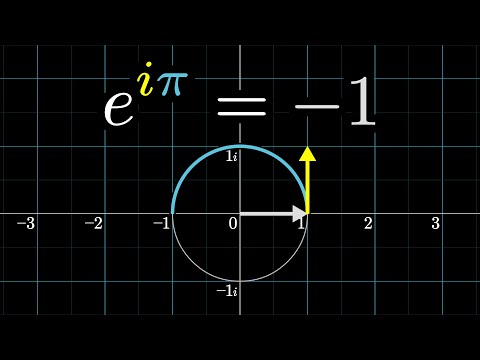
e^(iπ) in 3.14 minutes, using dynamics | DE5
 0:02:23
Visualization of Complex Functions: the Cubical Parabola Y = X ^ 3
 0:02:46
Visualization of Complex Functions: the Circle-Hyperbola Y = 1 / X
 0:02:27
Visualization of Complex Functions: the Cosine Y = cos X
 0:02:27
Visualization of Complex Functions: the Parabola Y = X ^ 2
 0:02:28
Visualization of Complex Functions: the 'Square Hyperbola' Y = 1 / X^2
 0:04:03
Complex Number: Visualization
 0:02:24
Visualization of Complex Functions: the Exponential Y = e ^ X
 0:02:20
Visualization of Complex Functions: the Cosecant Y = cosec X
 0:20:25
What does the Laplace Transform really tell us? A visual explanation (plus applications)
 0:11:23
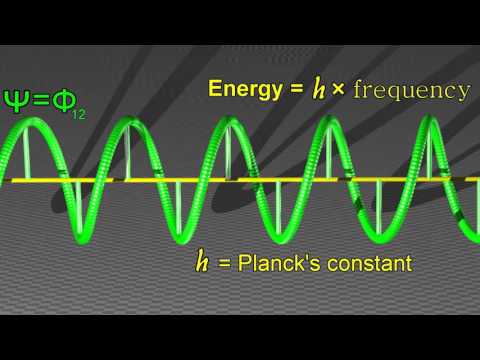
Quantum Wave Function Visualization
 0:00:19
visualization of Formula | beautiful mathematics
 0:18:39
Complex-valued Visualization
 0:00:16
EULER'S THEOREM VISUALIZATION #Complex #Number
 0:01:35
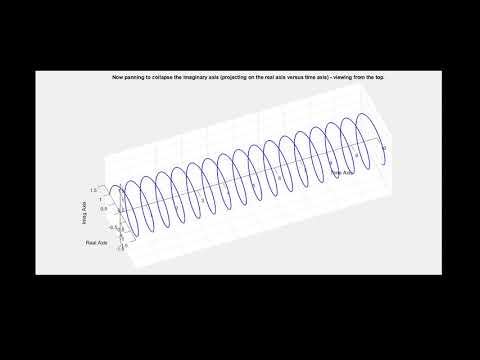
Visualization of a Continuous-Time Periodic Complex Exponential Signal
 0:00:53
Visualization of complex concepts
Комментарии