filmov
tv
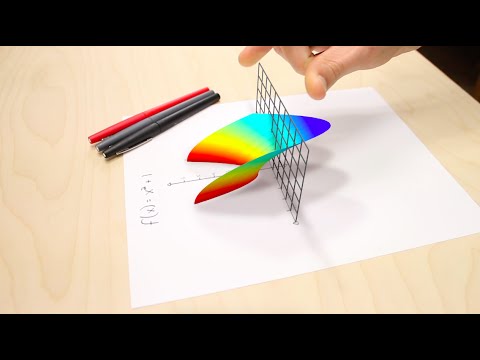
Visualization of Complex Functions: the Tangent Y = tan X

Показать описание
For Y = y1 + i y2 and X = x1 + i x2, the function Y = Y(X) is a 4D surface in space (X,Y) ~ (x1, x2, y1, y2). Let us project this "simply" unto our 2D screen ...
 0:14:32
 0:07:17
 0:02:27
 0:03:40
 0:05:47
 0:02:23
 0:02:27
 0:00:54
 0:02:46
 0:22:11
 0:02:24
 0:02:28
 0:01:52
 0:02:20
 0:02:29
 0:07:39
 0:18:39
 0:04:03
 0:14:54
 0:31:51
 0:14:49
 0:11:23
 0:23:48