filmov
tv
How to Apply Conditional Formatting in Matrix in Power BI | Power BI

Показать описание
About Video - In this Power Bi tutorial we learn how to apply conditional formatting in power bi. This is power bi tutorial for beginners. Here I request you to please subscribe our channel in future videos we will learn about how we create Power Bi dashboard, Power Bi dashboard design and Power Bi project. We cover all tutorials of Power Bi in Hindi. If you want to become Power Bi developer, you can start your journey from here.
Ready to take your data visualization to the next level in Power BI? Join us in this tutorial where we'll explore the powerful feature of conditional formatting in matrix visuals. Learn how to dynamically highlight and emphasize key insights in your data by applying conditional formatting rules. Whether you're a data analyst, business intelligence professional, or just getting started with Power BI, this tutorial will empower you to create visually impactful reports that drive actionable insights.
📌 Key Points Covered:
➟ Understanding Conditional Formatting: Get an overview of conditional formatting and its significance in data visualization.
➟ Applying Conditional Formatting in Matrix: Learn how to apply conditional formatting rules to matrix visuals in Power BI Desktop.
➟ Creating Formatting Rules: Explore various formatting rules and conditions to dynamically format cells based on data values.
➟ Customization Options: Discover how to customize conditional formatting settings, including colors, icons, and data bars.
➟ Interactive Visualization: Experience the power of interactive conditional formatting and its impact on data analysis.
👋 Additional resources
Hit the Subscribe button to stay tuned for more Power BI tutorials and data visualization tips!
#vinaysolanki #excelforfreshers #powerbi #powerbitutorial #powerbitips #powerbicourse #PowerBI #DataVisualization #ConditionalFormatting #MatrixVisuals #BusinessIntelligence #LearnPowerBI #DataAnalysis
 0:06:43
Conditional Formatting in Excel Tutorial
 0:00:27
How to: Use Conditional Formatting Rules in Sheets
 0:09:40
Excel Conditional Formatting with Formula | Highlight Rows based on a cell value
 0:04:21
Apply Conditional Formatting to an Entire Row - Excel Tutorial
 0:10:37
Master Conditional Formatting in Excel (The CORRECT Way)
 0:06:27
How To... Use Basic Conditional Formatting with an IF Statement in Excel 2010
 0:03:42
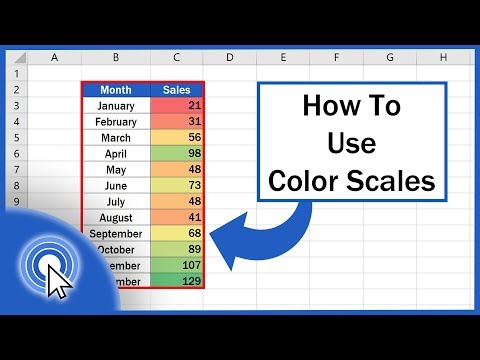
How to Use Color Scales in Excel (Conditional Formatting)
 0:05:02
Advanced Conditional Formatting in Excel | Conditional Formatting in Excel
 0:07:36
TLE Grade 7 Quarter 1 - ICT Week 7 Part 2 - SPREADSHEET SOFTWARE:CONDITIONAL FORMATTING FUNCTIONS
 0:09:29
Excel How To: Format Cells Based on Another Cell Value with Conditional Formatting
 0:04:25
Conditional Formatting Formulas - Mystery Solved with 3 Simple Rules
 0:05:20
MS Excel - Advanced Conditional Formatting
 0:10:42
MS Excel - Conditional Formatting Part 1
 0:20:59
Conditional Formatting in Excel | Excel Tutorials for Beginners
 0:09:23
Excel Conditional Formatting using Formulas
 0:08:39
How To Apply Conditional Formatting To Pivot Tables In Excel
 0:06:54
Excel Essentials -- Level UP! -- Conditional Formatting for Due Dates and Expiration Dates
 0:01:30
Excel Conditional Formatting based on Another Cell | Highlight Cells
 0:12:00
5 Conditional Formatting tips to make you a rock star at work 🤘
 0:07:02
Highlight Cells Based on Criteria in Excel | Conditional Formatting in Excel
 0:03:34
Conditional Formatting Based on Another Cells Values – Google Sheets
 0:16:28
Apply Conditional Formatting to Multiple Cells with a Single Formula in Excel
 0:04:46
conditional formatting in excel | find duplicates in excel @msexcelwire
 0:02:40
Conditional Formatting with the AND function in Excel by Chris Menard
Комментарии