filmov
tv
Draw Multiple Function Curves to Same Plot | Base R & ggplot2 Package | Using curve() & geom_line()

Показать описание
R code of this video:
my_fun1 <- function(x) { x^3 - x * 300 } # Create own functions
my_fun2 <- function(x) { x^3 * 2 + x^2 + x * 10 + 5 * 10^10 }
my_fun3 <- function(x) { - x^3 + x^2 - 2 * 10^10 }
curve(my_fun1, from = - 5000, to = 5000, col = 2) # Draw Base R plot
curve(my_fun2, from = - 5000, to = 5000, col = 3, add = TRUE)
curve(my_fun3, from = - 5000, to = 5000, col = 4, add = TRUE)
library("ggplot2")
values = c(my_fun1(- 5000:5000),
my_fun2(- 5000:5000),
my_fun3(- 5000:5000)),
fun = rep(c("fun1", "fun2", "fun3"), each = 10001))
ggplot(data_fun, # Draw ggplot2 plot
aes(x, values, col = fun)) +
geom_line()
Follow me on Social Media:
 0:05:04
Draw Multiple Function Curves to Same Plot | Base R & ggplot2 Package | Using curve() & geom...
 0:07:54
Visualizing Multi-variable Functions with Contour Plots
 0:08:19
How to plot any function curves in R | draw function curves using R | plot( ) | curve ( ) R function
 0:09:22
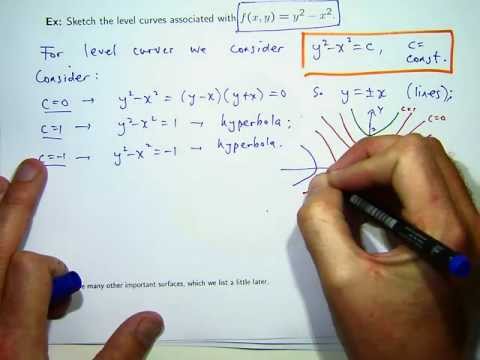
How to sketch level curves
 0:08:46
Draw Multiple Scatter Curves in Excel
 0:23:06
Level Curves and Traces of Multivariable Functions
 0:01:28
How to Find the Level Curves of z = 12 - 3x - 4y
 0:03:27
Plot Multiple Curves and Enhance Your Graphs | Matplotlib Tutorials
 2:36:55
Doctoral defense - Ualisson Donardelli Bellon
 0:02:54
Plotting multiple sine curves on the same figure using MATLAB
 0:09:26
How to Graph Multiple Curves
 1:49:07
Calculus 3 Lecture 13.1: Intro to Multivariable Functions (Domain, Sketching, Level Curves)
 0:05:50
Matlab/Octave Tutorial: Plot Multiple Curves in Same Figure
 0:18:27
How do you sketch level curves of multivariable functions?
 0:09:14
𝑯𝒐𝒘 𝒕𝒐 𝑴𝒂𝒌𝒆 : 𝑴𝒖𝒍𝒕𝒊−𝒀−𝑪𝒖𝒓𝒗𝒆𝒔 𝒃𝒚 𝑶𝒓𝒊𝒈𝒊𝒏𝑷𝒓𝒐...
 0:06:21
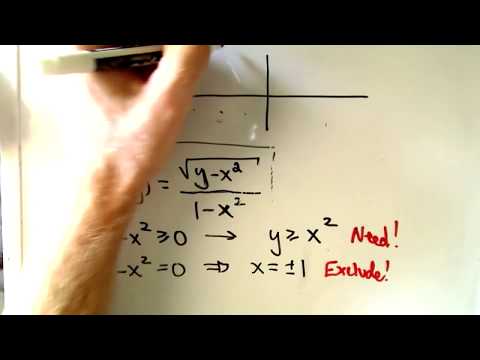
❖ Multivariable Calculus: Finding and Sketching the Domain ❖
 0:07:07
Graphing Multiple Function Transformations - Part 1 of 2
 0:21:20
Multiple Points for two dimensional curves | Advanced Calculus | BSc Mathematics
 0:04:51
Gnuplot #5 - Plot multiple curves
 0:06:24
How to fit non-linear equations in excel using solver
 0:09:26
How to Graph Multiple Curves (Accessible)
 0:05:53
MATLAB Plotting multiple continuous functions and theoretical curves in the same figure window
 0:21:15
Level Curves | Functions of Several Variables
 0:10:45
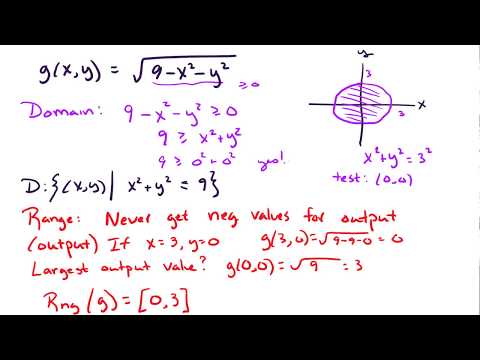
14.1 Domain and range for multi-variable functions
Комментарии