filmov
tv
Finding rate constants and order with excel 2013 - Real Chemistry

Показать описание
In this video you will learn how to plot the concentration of reactants vs time to determine the rate order and rate constant of a chemical reaction. This is accomplished by using integrated rate laws. For example, if a plot of concentration vs time is linear, then the reaction is a zeroth order reaction and the slope of the best fit line is the rate constant (times negative 1). If a plot of the natural log of concentration vs time is linear, then the reaction is first order and the slope is once again the rate constant (times negative 1). Lastly, if the plot of one over concentration vs time is linear, then the reaction is second order and the rate constant is the slope (not negative in this case).
 0:03:42
How to Find the Rate Law and Rate Constant (k)
 0:09:10
Kinetics: Initial Rates and Integrated Rate Laws
 0:34:53
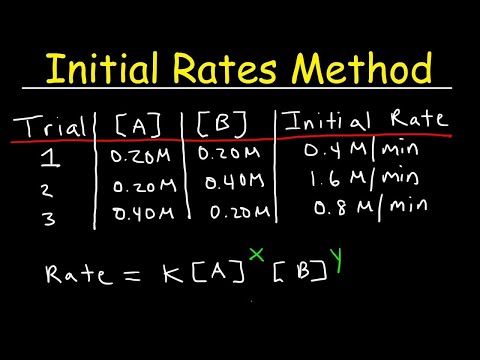
Chemical Kinetics - Initial Rates Method
 0:12:15
How To Determine The Units Of The Rate Constant K - Chemical Kinetics
 0:09:04
Finding rate constants and order with excel 2013 - Real Chemistry
 0:02:46
Working out order from a rate table - tricky example
 0:08:15
First Order Elimination Rate Constant and Half-life | A closer look - Lect 11
 0:01:46
Determining the Units for the Rate Constant k
 0:40:12
L06: Kinetics of 2nd order reactions (Part I)
 0:05:08
Units of the rate constant | Kinetics | AP Chemistry | Khan Academy
 0:05:43
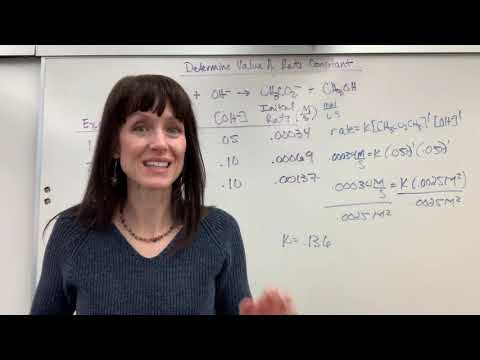
Determine Value of Rate Constant
 0:02:42
How to Find the Rate Constant for a Zero Order Reaction from a Graph
 0:48:46
Integrated Rate Laws - Zero, First, & Second Order Reactions - Chemical Kinetics
 0:10:49
Solving a Rate Law Using the Initial Rates Method
 0:00:41
Rate Equation | Orders From Initial Rate Data #chemistry #learning
 0:03:46
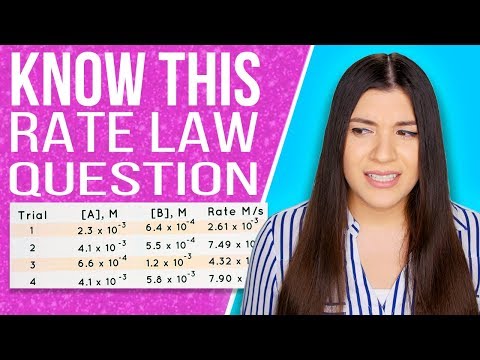
DON'T MISS THIS Rate Law and Rate Constant Question
 0:09:21
Plotting data for a first-order reaction | Kinetics | Chemistry | Khan Academy
 0:25:16
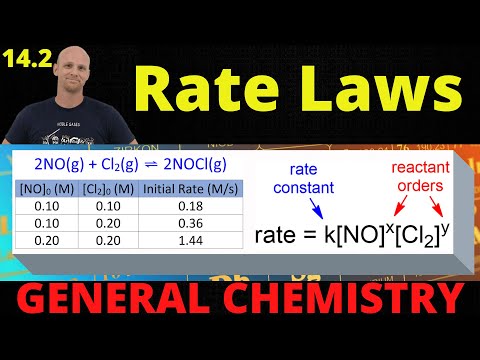
14.2 Rate Laws | General Chemistry
 0:09:50
Working out order from rate tables (more difficult example)
 0:15:56
Order and Rate Equations | A-Level Chemsitry
 0:18:48
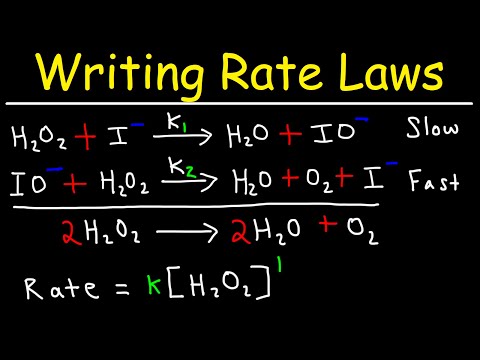
Writing Rate Laws of Reaction Mechanisms Using The Rate Determining Step - Chemical Kinetics
 0:01:43
Calculating a rate constant from a half life
 0:18:54
Rate Law Problems
 0:07:03
⚗️ Determining the Order and Rate Constant of a Reaction (Question 1)
Комментарии