filmov
tv
Quantitative Research | Likert Scale: Should I Use Parametric or Non-parametric Tests?

Показать описание
A passionate dispute over the use of parametric versus non-parametric methods for the analysis of Likert scale data has raged for the past eighty years. The answer is not a simple “yes” or “no” but is related to hypotheses, objectives, risks, and paradigms. In this video, I will be presenting to you the arguments of the two sides of this dispute: the ordinalist which believe that Likert Scale data should be analyzed by nonparametric tests, and intervalist which believe the other way around.
Carifio J, Perla R. Resolving the 50-year Debate Around using and Misusing Likert Scales. Med Educ. 2008;42(12):1150–1152.
Carifio J, Perla RJ. Ten Common Misunderstandings, Misconceptions, Persistent Myths and urban legends about Likert scales and Likert response Formats and their Antidotes. J Social Sci. 2007;3(3):106.
Gail M. Sullivan and Anthony R. Artino Jr (2013) Analyzing and Interpreting Data From Likert-Type Scales. Journal of Graduate Medical Education: December 2013, Vol. 5, No. 4, pp. 541-542.
Huiping Wu & Shing-On Leung (2017) Can Likert Scales be Treated as Interval Scales?—A Simulation Study, Journal of Social Service Research, 43:4, 527-532, DOI: 10.1080/01488376.2017.1329775
Mircioiu, C.; Atkinson, J. A Comparison of Parametric and Non-Parametric Methods Applied to a Likert Scale. Pharmacy 2017, 5, 26.
Sullivan, G. M., & Artino, A. R. (2013). Analyzing and Interpreting Data From Likert-Type Scales. Journal of Graduate Medical Education, 5(4), 541–542.
 0:07:52
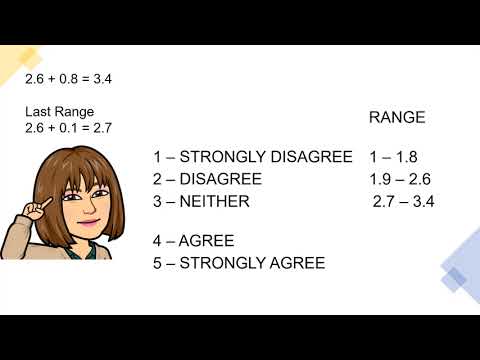
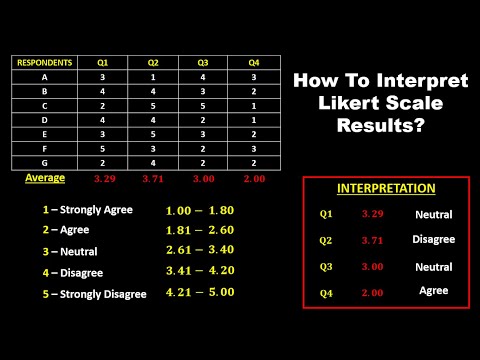
HOW TO INTERPRET LIKERT SCALE RESULTS
 0:06:36
THE 5-POINT LIKERT SCALE INTERPRETATION || RESEARCH
 0:05:51
Likert Scale | Quantitative Research Methodology | SOC509_Topic057
 0:10:02
Quantitative Research | Likert Scale: Should I Use Parametric or Non-parametric Tests?
![Likert-Scale [Simply Explained]](https://i.ytimg.com/vi/Tf_71r1Ve5w/hqdefault.jpg) 0:05:58
0:05:58
Likert-Scale [Simply Explained]
 0:13:20
The best way to analyze LIKERT SCALE and INTERPRET the results
 0:03:54
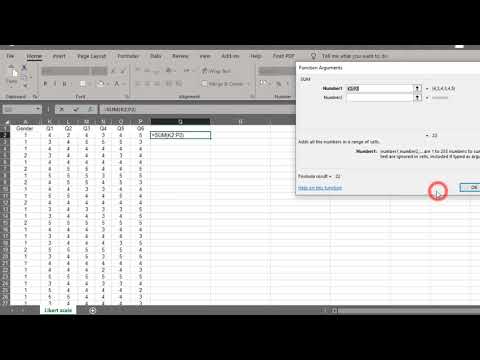
How to analyze Likert Scale using Excel
 0:07:03
HOW TO INTERPRET THE LIKERT SCALE || 5-POINT LIKERT SCALE
 0:06:58
How to Find the Frequency Distribution and Mean of Research Data using EXCEL
 0:37:10
Likert Scale Data Analysis and Interpretation of Results
 0:06:55
HOW TO INTERPRET 4-POINT LIKERT SCALE RESULT?
 0:01:43
Quantitative research: rating scales
 0:01:51
Common Scales Used in Quantitative Research: Likert Scale (Practical Research 2)
 0:06:04
Analyze and chart Agree/Disagree Likert scale survey data using Pivot Table
 0:03:54
Likert scale analysis and interpretation using descriptive statistics (frequencies and percentages)
 0:15:25
HOW TO COMPUTE LIKERT SCALE, T-TEST & PEARSON R
 0:08:55
How to analyze Likert Scale and interpret the results
 0:05:28
How to get Measurement Scale Items for constructs?
 0:05:29
Likert Scales - Reverse Scored/Negative Items (Part 1)
 0:11:17
How to analyze data in Excel for Likert Scale Questions | Create graphs for likert scale questions
 0:31:03
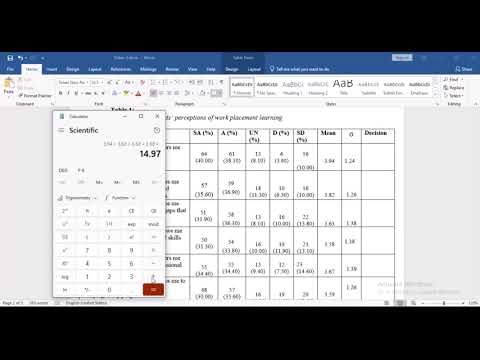
SPSS: How to Analyse and Interpret LIKERT-SCALE Questionnaire Using SPSS
 0:04:50
How to import, code and analyse Likert scale from Google Forms into SPSS
 0:03:52
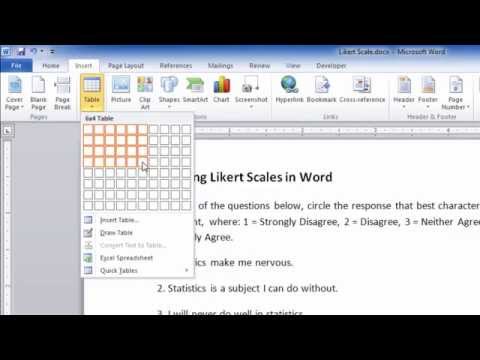
How to Create a Likert Scale/Questionnaire in Word
 0:12:45
LESSON 41 - LIKERT SCALE || WHAT IS LIKERT? || DOES IT COLLECT CONTINUOUS OR CATEGORICAL DATA?
Комментарии