filmov
tv
Plot Spatial Data / Shapefiles in R | Gun Violence in Chicago

Показать описание
How to read in spatial data and plot shapefiles and spatial points in R.
Thanks for watching!! ❤️
//R code
//Gun Violence Archive
//Shapefile of Chicago communities
Tip Jar 👉🏻👈🏻
♫ Eric Skiff - Chibi Ninja
Thanks for watching!! ❤️
//R code
//Gun Violence Archive
//Shapefile of Chicago communities
Tip Jar 👉🏻👈🏻
♫ Eric Skiff - Chibi Ninja
 0:06:39
Plot Spatial Data / Shapefiles in R | Gun Violence in Chicago
 0:08:59
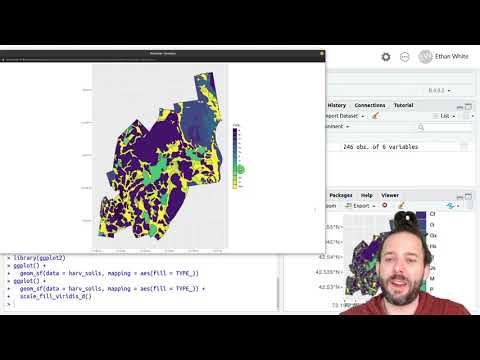
Geospatial Data in R - Mapping Polygons Based on Their Properties
 0:19:12
Geospatial Data in R - Cropping Data
 0:26:28
Creating Shapefile and Study Area Map for any Location | Latest Tutorial using QGIS
 0:21:34
How to Perform a Simple Spatial Data Analysis using QGIS
 0:05:44
Geospatial Data in R - Maintaining Projections When Plotting With ggplot
 0:04:20
GIS and R - merging spatial data
 0:16:31
Working with sf geospatial geometries in R
 0:29:09
Talks - Lazouich Ford: Geospatial Validations Using FastAPI and PostGIS
 0:45:24
ChatGPT GIS Analysis Tutorial - Part 1
 0:03:40
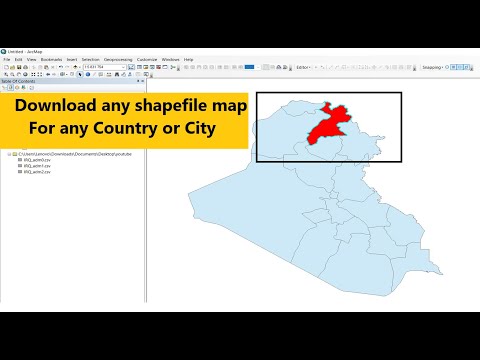
How to download any shapefile map [For City or Country]
 0:16:34
GIS Tutorial | Part 08 | Create Spatial Distribution Map | ArcGIS | Interpolation | Spatial Analysis
 0:06:59
Spatial Interpolation (IDW)Tutorial Using QGIS
 0:08:03
How to plot a shapefile using GeoPandas
 0:06:28
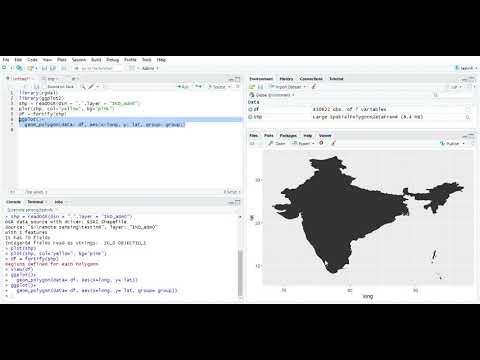
How to import and visualize shapefiles in RStudio
 0:04:21
Plotting Geospatial data with Python - Folium - Part 1
 0:12:17
How to collect spatial data from google map and collected data plotting in Arc GIS.
 0:20:34
Geospatial Data in R - Introduction to Projections
 0:04:42
QGIS Tutorials 11: Importing GPS Data & Convert to Shapefile using QGIS | QGIS Beginners | GPX f...
 0:09:02
How to get Openstreetmap data in shapefile type
 0:01:00
How to create a #shapefile with #ArcGIS Pro #GIS #Maps #spatial #data #geographicinformationsystem
 1:27:05
Intro to Spatial Data
 0:07:03
Download Water body data (Shapefile) Lakes, River, Wetland of any Location
 0:15:09
plotting maps with geopandas and matplotlib
Комментарии