filmov
tv
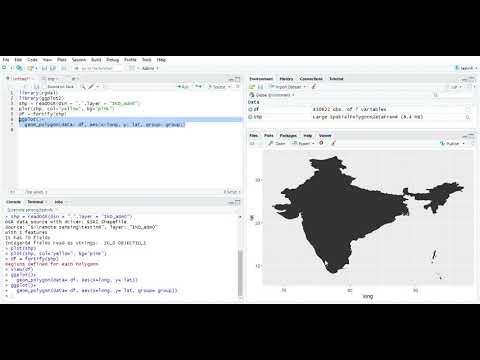
How to import and visualize shapefiles in RStudio
Показать описание
This tutorial explains how to load shapefile in RStudio using rgdal library and visualize using ggplot2 library.
code:
library(rgdal)
library(ggplot2)
shp = readOGR(dsn=".", layer="shapefilename")
plot(shp)
df = fortify(shp)
ggplot()+
geom_polygon(data = df, aes(x = long, y =lat, group=group))
code:
library(rgdal)
library(ggplot2)
shp = readOGR(dsn=".", layer="shapefilename")
plot(shp)
df = fortify(shp)
ggplot()+
geom_polygon(data = df, aes(x = long, y =lat, group=group))
How to import and visualize shapefiles in RStudio
 0:05:38
How to Import and Visualize ESRI Shapefiles in Google Earth Pro
 0:01:37
How to import data into Rstudio
 0:01:54
Your First Data Import and Visualization in LabPlot
 0:05:16
Import Data into R Studio
 0:22:01
Intro to Data Analysis / Visualization with Python, Matplotlib and Pandas | Matplotlib Tutorial
 0:06:52
How to import CSV data, visualize locations, inspect and change schema
 0:09:19
Tutorial: SOLIDWORKS Visualize: Import
 0:31:26
How to import API data in Google Sheets and visualize it in Google Data Studio
 0:01:43
how to import excel data into arcgis quickly
 0:08:18
Effortlessly Import and Visualize Medical Imaging Data with ImFusion Suite
 0:05:30
Ways to Import Images In React Js Project
 0:14:43
How to Import, Manipulate & Visualize Data Using the tidyverse in R | readr, dplyr & ggplot2...
 0:02:09
Lumion 12.3 tutorial: How to import custom decals into your visualization project
 0:04:00
Network visualization tutorial: PPI import, data import, coloring, network clustering, and layout
 0:10:15
How to Import Map Data into Google MyMaps
 0:03:34
How to Import Floor Plans to Visualize in 3D | DreamPlan Home Design Software Tutorial
 0:02:20
How to import a CSV file into Python (Jupyter notebook)
 0:05:44
How to import experimental data and plot in python ?
 0:28:01
Material Properties: How to Import, Set the Pattern, and Visualize in 3D (Re-Run)
 0:08:21
Import Latitude & Longitude Coordinates to Google Earth from CSV Excel file
 0:04:47
How to Import Data from SQL Server into PowerBI | MiTutorials
 0:04:26
How to Import and Read Text Files in R | Step-by-Step Guide
 0:10:43
How to import SOLIDWORKS motion animations to SOLIDWORKS Visualize | Importanting Animations
Комментарии