filmov
tv
Farm Performance Management Dashboard | Microsoft Excel without VBA | Video Tutorial #2

Показать описание
Farm Performance Management Dashboard - Advanced Excel Analytics Tool
The first video tutorial is here!
Courses & Playlists:
0:00, Dashboard overview
0:40, Daily farm records Title
01:11, Insert Pivot table for the KPIs
04:51, Pen house slicer and dates Timeline
06:26, Total flock stock in the Beginning and in the end
10:20, Total birds mortality
11:32, Egg Production, Cumulative Eggs and Trays
15:33, Total Feed Intake, Eggs Cost and weights
17:17, Breed Names, Stocking Date, Hatched Date, and Birds Age
21:07, Daily Egg Register
25:51, Comments and notice bar
28:33, Dashboard Protection
30:06, Final dashboard design
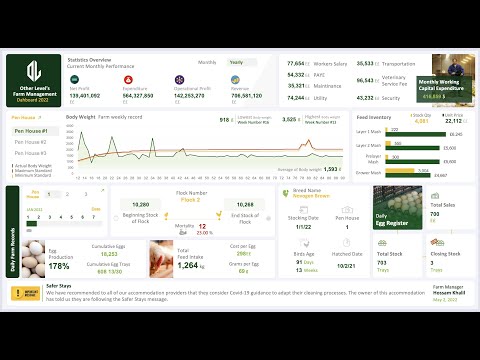
Enhance your agricultural operations with the Farm Performance Management Dashboard, an advanced Excel Dashboard designed by Other Levels. This innovative tool empowers farmers, managers, and agribusiness professionals to monitor and optimize farm performance with precision and ease.
Comprehensive Farm Analytics
Track key metrics such as daily bird weight, feed intake, egg production, and mortality rates across multiple pen houses. Starting from week 12 up to week 90, the dashboard delivers insights into actual weights, bird counts, and averages for effective flock management.
Optimize your farm’s profitability with in-depth financial metrics, including Yearly and Monthly Revenue, Operational Profit, and Net Profit. Keep track of expenditures like workers' salaries, utilities, transportation, maintenance, and veterinary fees, ensuring a clear understanding of your working capital.
Stay on top of your inventory with detailed records of feed stocks, unit prices, and available quantities. The integrated Egg Register provides a comprehensive view of stock trays, sales, and closing balances, supporting seamless inventory management.
Built with an intuitive interface and dynamic visuals, this dashboard makes complex data easy to interpret. Features like slicers and pivot tables allow users to filter and analyze data based on specific criteria, providing actionable insights at a glance.
Key Features
Daily Bird's wight record For three Pen Houses:
Starting from week 12 until week number 90, showing the actual weight, count of birds, and average weight.
Daily record for the following:
Full Date
Year
Month
Day
Stocking Date
Flock Number
Pen House
Breed Name
Hatched Date
Birds Age Days
Birds Age Weeks
Beginning Stock #Flock
Total Mortality
End Stock #Flock
Cumulative Mortality
Cumulative Eggs
Cumulative Egg Trays
Egg Production %
Total Feed Intake (Kg)
Feed Conversion g/egg
Feed Conversion cost (N)/egg
Total Stock (Trays)
Sales (Trays)
Closing Stock (Trays)
Income Details:
Yearly Revenue
Monthly Revenue
Yearly Operational Profit
Monthly Operational Profit
Yearly Expenditure
Monthly Expenditure
Yearly Net Profit
Monthly Net Profit
Total Monthly Working Capital Expenditure:
Monthly Working Capital Expenditure
Workers Salary
PAYE
Transportation
Maintenance
Veterinary Service Fee
Security
Feed Inventory
Feeds Name
Unit Price
Quantity in Stock
------------------------------------------------------------
Welcome to Other Level’s,
Your go to resource for unlocking the full potential of Microsoft Office.
Whether you're looking to enhance your skills in Excel, Word, PowerPoint, or data analysis, we simplify complex tools with clear, easy to follow tutorials.
Master Microsoft Office with Step by Step Tutorials and Expert Tips!
What sets us apart:
- Comprehensive breakdown of essential formulas, digital designs, and data visualization techniques.
- Straightforward, impactful videos focused on real world business applications.
- We create professional dashboards that help you elevate your productivity and projects.
- No unnecessary jargon just relevant content that helps you master Microsoft tools efficiently.
- Honest, relevant titles and thumbnails that reflect the value we deliver in every video.
Join us and transform the way you work with Microsoft Office.
Every second of our content is designed to help you succeed!
Copyright © 2025 Other Level's. All rights reserved.
"Any illegal reproduction of this content in any form will result in immediate action against the person concerned."
#Farm_Performance_Management #Excel #Dashboard
The first video tutorial is here!
Courses & Playlists:
0:00, Dashboard overview
0:40, Daily farm records Title
01:11, Insert Pivot table for the KPIs
04:51, Pen house slicer and dates Timeline
06:26, Total flock stock in the Beginning and in the end
10:20, Total birds mortality
11:32, Egg Production, Cumulative Eggs and Trays
15:33, Total Feed Intake, Eggs Cost and weights
17:17, Breed Names, Stocking Date, Hatched Date, and Birds Age
21:07, Daily Egg Register
25:51, Comments and notice bar
28:33, Dashboard Protection
30:06, Final dashboard design
Enhance your agricultural operations with the Farm Performance Management Dashboard, an advanced Excel Dashboard designed by Other Levels. This innovative tool empowers farmers, managers, and agribusiness professionals to monitor and optimize farm performance with precision and ease.
Comprehensive Farm Analytics
Track key metrics such as daily bird weight, feed intake, egg production, and mortality rates across multiple pen houses. Starting from week 12 up to week 90, the dashboard delivers insights into actual weights, bird counts, and averages for effective flock management.
Optimize your farm’s profitability with in-depth financial metrics, including Yearly and Monthly Revenue, Operational Profit, and Net Profit. Keep track of expenditures like workers' salaries, utilities, transportation, maintenance, and veterinary fees, ensuring a clear understanding of your working capital.
Stay on top of your inventory with detailed records of feed stocks, unit prices, and available quantities. The integrated Egg Register provides a comprehensive view of stock trays, sales, and closing balances, supporting seamless inventory management.
Built with an intuitive interface and dynamic visuals, this dashboard makes complex data easy to interpret. Features like slicers and pivot tables allow users to filter and analyze data based on specific criteria, providing actionable insights at a glance.
Key Features
Daily Bird's wight record For three Pen Houses:
Starting from week 12 until week number 90, showing the actual weight, count of birds, and average weight.
Daily record for the following:
Full Date
Year
Month
Day
Stocking Date
Flock Number
Pen House
Breed Name
Hatched Date
Birds Age Days
Birds Age Weeks
Beginning Stock #Flock
Total Mortality
End Stock #Flock
Cumulative Mortality
Cumulative Eggs
Cumulative Egg Trays
Egg Production %
Total Feed Intake (Kg)
Feed Conversion g/egg
Feed Conversion cost (N)/egg
Total Stock (Trays)
Sales (Trays)
Closing Stock (Trays)
Income Details:
Yearly Revenue
Monthly Revenue
Yearly Operational Profit
Monthly Operational Profit
Yearly Expenditure
Monthly Expenditure
Yearly Net Profit
Monthly Net Profit
Total Monthly Working Capital Expenditure:
Monthly Working Capital Expenditure
Workers Salary
PAYE
Transportation
Maintenance
Veterinary Service Fee
Security
Feed Inventory
Feeds Name
Unit Price
Quantity in Stock
------------------------------------------------------------
Welcome to Other Level’s,
Your go to resource for unlocking the full potential of Microsoft Office.
Whether you're looking to enhance your skills in Excel, Word, PowerPoint, or data analysis, we simplify complex tools with clear, easy to follow tutorials.
Master Microsoft Office with Step by Step Tutorials and Expert Tips!
What sets us apart:
- Comprehensive breakdown of essential formulas, digital designs, and data visualization techniques.
- Straightforward, impactful videos focused on real world business applications.
- We create professional dashboards that help you elevate your productivity and projects.
- No unnecessary jargon just relevant content that helps you master Microsoft tools efficiently.
- Honest, relevant titles and thumbnails that reflect the value we deliver in every video.
Join us and transform the way you work with Microsoft Office.
Every second of our content is designed to help you succeed!
Copyright © 2025 Other Level's. All rights reserved.
"Any illegal reproduction of this content in any form will result in immediate action against the person concerned."
#Farm_Performance_Management #Excel #Dashboard
 0:46:26
Farm Performance Management Made EASY with Microsoft Excel!
 0:30:44
Farm Performance Management Dashboard | Microsoft Excel without VBA | Video Tutorial #2
 0:03:42
Fast Multi-Farm Performance - Farm Management
 0:30:39
Mind Your Farm Business — Ep 74: The importance of key performance indicators
 0:03:52
Fischl- A Modern Farm Management Dashboard
 0:06:06
Step 3. Monitoring crop performance
 0:02:33
Herd Management Dashboard
 0:01:28
How to Use Dashboard Grower (Layer Farm Manager Apps)
 0:02:15
KPIs
 0:01:20
Excel Interactive Dashboard (No VBA Macros) - Renewable Power Plant Performance Monitoring
 0:06:14
Tour of FarmRaise Dashboard
 0:01:17
EDGE Feed Management Dashboard
 0:07:32
Top 5 KPIs for Project Managers [Pay Attention to These!]
 0:03:55
How to use your Producer Dashboard
 0:02:07
FarmManager - Overviews Dashboard - E12
 0:05:57
Farms Machinery Management Excel Template Step-by-Step Video Tutorial by Simple Sheets
 0:02:05
ROMI Farmers Dashboard
 0:00:56
Herd Management | HerdView® App
 0:00:35
How to Use Dashboard Global (Layer Farm Manager Apps)
 0:05:29
Equipment Maintenance Management Excel & Google Sheets CMMS Template Step-by-Step Video Tutorial...
 0:01:31
SolarWinds Orion Modern Dashboards Overview
 0:05:15
Tutorial Decision Maker: Dashboard Global, Grower, Layer (Layer Farm Manager Apps)
 0:01:11
Next Farming Dashboard
 0:03:32
BC Salmon Farmers | Performance Dashboard Explainer Video
Комментарии