filmov
tv
Farm Performance Management Made EASY with Microsoft Excel!

Показать описание
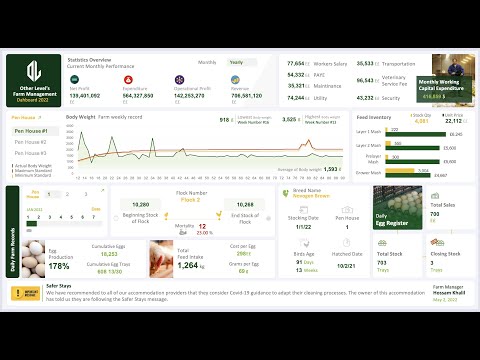
Farm Performance Management Dashboard - Advanced Excel Analytics Tool
Courses & Playlists:
0:00, Dashboard overview
0:49, Annual and monthly key status and statistics overview
0:54, Monthly working capital expenditures
0:58, Body weight chart
01:12, Feed Inventory quantity and prices
01:15, Daily farm records
01:21, Flock in the Beginning and the End of stocking
01:27, Egg production, Cumulative eggs, and Trays
01:31, Feed intake eggs cost and weights
01:34, Stocking date, Hatched date, and bird's age
01:38, Daily egg register showing sales and stock status
01:42, Comments and notice bar
01:44, Color Codes & Fonts
02:00, Enhance the data tables
02:00, Enhance the data tables
03:15, Insert buttons with Hyperlinks
09:21, Design the Dashboard Background
10:55, Company Logo and Main title
12:24, Key status and statistics overview
20:05, Monthly working capital expenditures
28:07, Explaining Pen Houses report
29:53, use Index Formula
29:54, Merge data for three Pen Houses
32:58, Insert Line chart & Slicer
36:23, Highlight the lowest, highest, and average weights
43:12, Quantity and prices for Feed stock
Enhance your agricultural operations with the Farm Performance Management Dashboard, an advanced Excel Dashboard designed by Other Levels. This innovative tool empowers farmers, managers, and agribusiness professionals to monitor and optimize farm performance with precision and ease.
Comprehensive Farm Analytics
Track key metrics such as daily bird weight, feed intake, egg production, and mortality rates across multiple pen houses. Starting from week 12 up to week 90, the dashboard delivers insights into actual weights, bird counts, and averages for effective flock management.
Optimize your farm’s profitability with in-depth financial metrics, including Yearly and Monthly Revenue, Operational Profit, and Net Profit. Keep track of expenditures like workers' salaries, utilities, transportation, maintenance, and veterinary fees, ensuring a clear understanding of your working capital.
Key Features
Daily Bird's wight record For three Pen Houses:
Starting from week 12 until week number 90, showing the actual weight, count of birds, and average weight.
Daily record for the following:
Full Date
Year
Month
Day
Stocking Date
Flock Number
Pen House
Breed Name
Hatched Date
Birds Age Days
Birds Age Weeks
Beginning Stock #Flock
Total Mortality
End Stock #Flock
Cumulative Mortality
Cumulative Eggs
Cumulative Egg Trays
Egg Production %
Total Feed Intake (Kg)
Feed Conversion g/egg
Feed Conversion cost (N)/egg
Total Stock (Trays)
Sales (Trays)
Closing Stock (Trays)
Income Details:
Yearly Revenue
Monthly Revenue
Yearly Operational Profit
Monthly Operational Profit
Yearly Expenditure
Monthly Expenditure
Yearly Net Profit
Monthly Net Profit
Total Monthly Working Capital Expenditure:
Monthly Working Capital Expenditure
Workers Salary
PAYE
Transportation
Maintenance
Veterinary Service Fee
Security
Feed Inventory
Feeds Name
Unit Price
Quantity in Stock
------------------------------------------------------------
Welcome to Other Level’s,
Your go to resource for unlocking the full potential of Microsoft Office.
Whether you're looking to enhance your skills in Excel, Word, PowerPoint, or data analysis, we simplify complex tools with clear, easy to follow tutorials.
Master Microsoft Office with Step by Step Tutorials and Expert Tips!
What sets us apart:
- Comprehensive breakdown of essential formulas, digital designs, and data visualization techniques.
- Straightforward, impactful videos focused on real world business applications.
- We create professional dashboards that help you elevate your productivity and projects.
- No unnecessary jargon just relevant content that helps you master Microsoft tools efficiently.
- Honest, relevant titles and thumbnails that reflect the value we deliver in every video.
Join us and transform the way you work with Microsoft Office.
Every second of our content is designed to help you succeed!
Copyright © 2025 Other Level's. All rights reserved.
"Any illegal reproduction of this content in any form will result in immediate action against the person concerned."
#Farm_Performance_Management #Excel #Dashboard
 0:46:26
Farm Performance Management Made EASY with Microsoft Excel!
 0:30:44
Farm Performance Management Dashboard | Microsoft Excel without VBA | Video Tutorial #2
 0:03:42
Fast Multi-Farm Performance - Farm Management
 0:14:18
Farm performance: Q&A
 0:05:57
Farms Machinery Management Excel Template Step-by-Step Video Tutorial by Simple Sheets
 0:00:16
Did you know that in FARM SIM 22 there's a broken field mechanic…
 0:00:43
Farm Business Profitability Made Easier
 0:00:56
Herd Management | HerdView® App
 0:00:13
new innovative agriculture model making covering the land with plastic cover #shorts howtofunda
 0:00:30
Why you should Automate your Farm Business Management? #pasture #farming #livestock #shorts
 0:01:00
Grow The Best Tomatoes This Summer By Pruning! Especially If You’re Growing Indeterminate Tomatoes!...
 0:00:23
GREAT FARM BROILER FLOOR RAISE SYSTEM | Drinking Water And Feeding Line Installation #greatfarm
 0:00:11
Beautiful Cabbage Farm Vegetables Satisfying video #satisfying #short #agriculture
 0:00:12
manually writing data to a HDD...kinda #shorts
 0:00:24
Poultry Farm Management Made Simple with PoultryCare!
 0:01:28
How to Use Dashboard Grower (Layer Farm Manager Apps)
 0:00:18
POV: you’re 6’9” 400 pounds and booked the middle seat
 0:00:11
What happened when I fall #surf #surfing #athlete #waves #surfers #skate #wsl #fit
 0:00:16
5000KM distance walkie-talkie,you can talk in real time
 0:00:58
Avoid Whey Protein To Support A Healthy Liver #drberg #protein #whey #proteinpowder #liver #keto
 0:00:15
Google Ads + Shopify ($10,000 Days)
 0:00:27
I Trained With The US ARMY For 100 Hours!
 0:00:10
COVER LETTER for CVs and RESUMES #shorts
 0:00:16
Fix Games Stuttering In 15 Seconds
Комментарии