filmov
tv
How to solve probability using a 2-way or contingency table, venn diagram, and tree diagram

Показать описание
This statistics lesson shows you how to answer probability questions using different methods: two-way table, Venn diagram, and tree diagram. Answering probability question is easier if you can visualize the problem better. These methods will help you answer probability questions if you can illustrate the experiment using any of the visuals.
1:20 Probability given a 2 way table gender vs ear piercing
5:02 solving probability by showing venn diagram
9:54 Answering probability with an aid of a tree diagram
1:20 Probability given a 2 way table gender vs ear piercing
5:02 solving probability by showing venn diagram
9:54 Answering probability with an aid of a tree diagram
 0:11:28
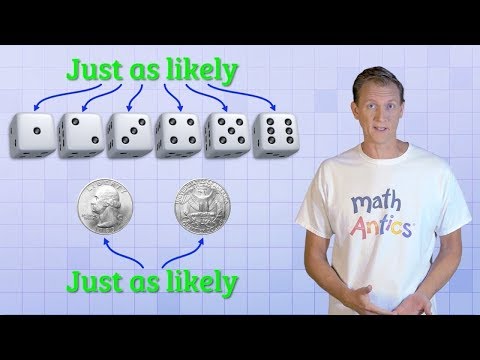
Math Antics - Basic Probability
 0:02:56
Finding probability example | Probability and Statistics | Khan Academy
 0:04:00
Probability: The Basics EXPLAINED with Examples
 0:00:25
Probability of Consecutive Coin Flips
 0:00:51
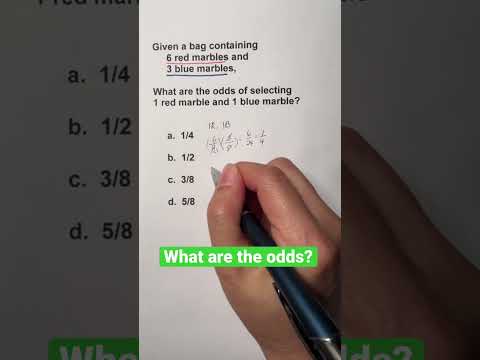
Probability Math Problem | Selecting different colored marbles
 0:16:21
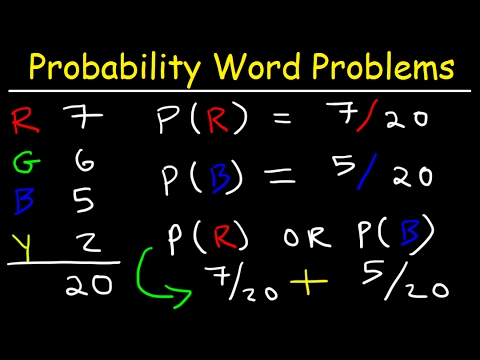
How to Solve Probability Word Problems | P(A and B) | P(A or B) | Binomial Probability
 0:00:42
Do You REMEMBER How Probability WORKS? #Shorts #math #maths #mathematics #SAT #education
 0:02:40
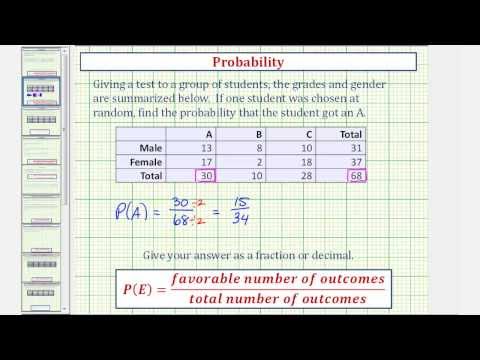
Ex: Basic Example of Finding Probability From a Table
 11:54:58
Learn Statistical distributions in 6 hours session 36
 0:16:59
Introduction to Probability, Basic Overview - Sample Space, & Tree Diagrams
 0:10:02
Multiplication & Addition Rule - Probability - Mutually Exclusive & Independent Events
 0:18:04
Probability Explained!
 0:00:38
Probability of a Dice Roll | Statistics & Math Practice | JusticeTheTutor #shorts #math #maths
 0:06:14
Intro to Conditional Probability
 0:20:27
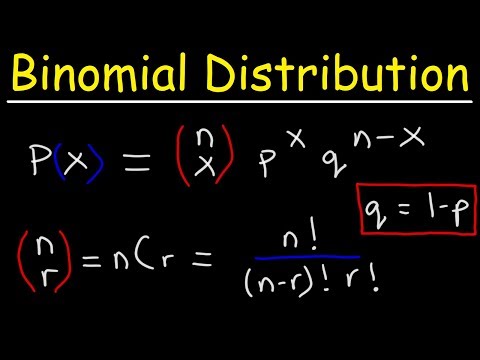
Finding The Probability of a Binomial Distribution Plus Mean & Standard Deviation
 0:20:36
Test B (09 to 11) Solving Probability Word Problems Using Probability Formulas
 0:00:05
Probability using binomial distribution
 0:06:05
Finding Probability Using Fractions
 0:00:56
How to solve Probability questions| Probability Questions #shorts #viralvideo #trending #probability
 0:21:46
PROBABILITY | Addition and Multiplication Rule | Mutually Exclusive and Independent events
 0:06:05
Probability Examples with Cards
 0:00:24
how to find probability for normal distribution using fx-570EX casio part 1
 0:04:33
Probability Calculations using Venn Diagram
 0:05:24
2 Examples of Probability With & Without Replacement
Комментарии