filmov
tv
Interactive Route Line Map in Python using folium
Показать описание
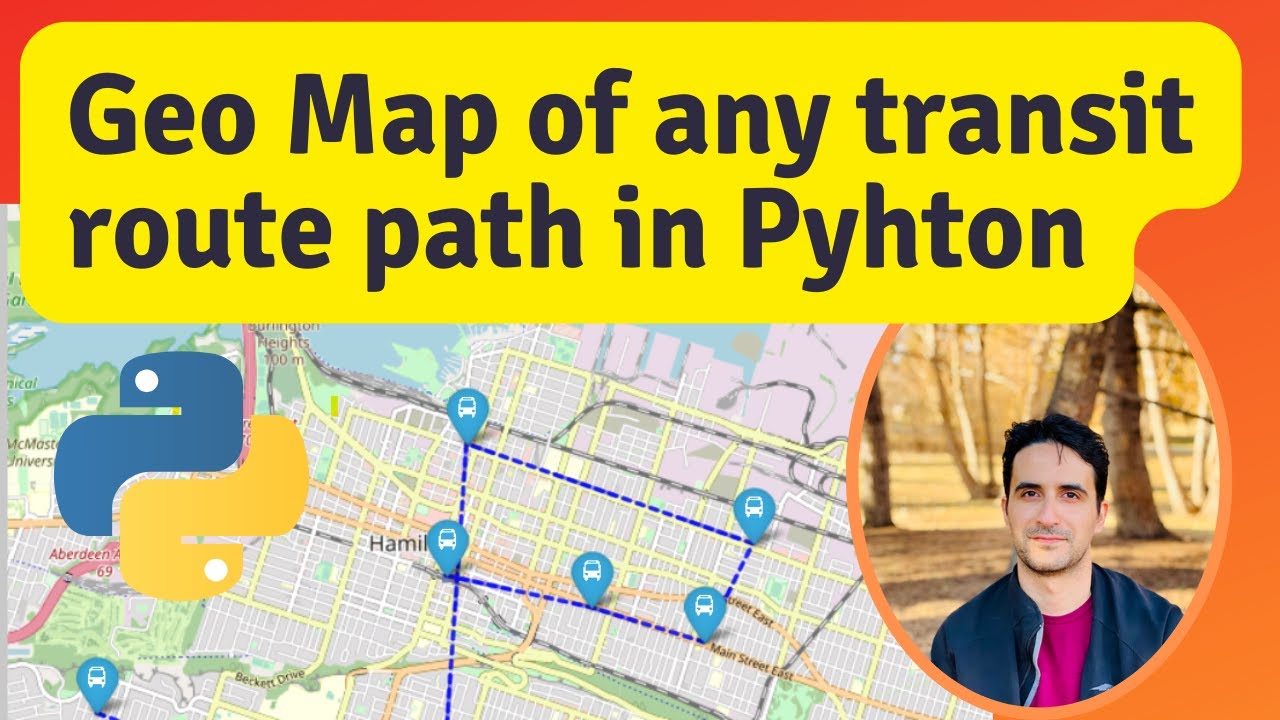
This tutorial shows how to visualize an interactive map in python. We visualize a map of polyline or a route or road map in python. We use an example of transit or bus route map to visualize in this blog.
interactive Route Line Map in Python.
Given a set of pre-determined coordinates, latitudes and longitudes, we set up customization for choice of icons of transit bus stops, colors, patterns of connected lines or polylines and so on and so forth. In the following we provide and step-by-step python tutorial on map or GIS visualization using folium package examples.
Related links for this video:
Please like this video and subscribe to the channel for more tutorial videos, particularly with a focus on:
• to provide ready-to-execute solutions to achieve data goals of professionals regardless of your previous knowledge on technical background of programming and data.
• a series of data and business insight from the perspective of an economist and applied data scientist in industry for those interested in the "under the hood" of the data related topics.
About me:
I am Dimo, an economist with a data science focus in industry. I am sharing my productivity, tech-solution, data visualization and analysis experiences, statistical - econometrics - machine learning interpretations in format of how-to tutorials in this channel.
My Social Media Links & Profiles:
Credit
Music:
 0:10:01
Interactive Route Line Map in Python using folium
 0:13:11
Interactive route line map in python using folium
 0:02:57
Create an Interactive Flight Route Map Using iMapBuilder
 0:07:34
Fastest Travel Map Animation! | DETAILED Tutorial | FCPX | Google Maps + Earth Studio
 0:00:15
Animated Travel Map | After Effects | Animation
 0:06:54
Custom Canva Map Animation | Car Route 🚗
 0:11:29
Top 20 Google Maps Tips & Tricks: All the best features you should know!
 0:06:28
Custom Google Maps Tutorial – How to Create Custom Vector Map in 5 Minutes
 0:12:53
🌍 How to make interactive Excel Map charts
 0:07:06
How to Create a Multiple Locations Map on Google – Full Tutorial
 0:04:58
10 Best Travel Map Animation Templates
 0:03:33
Create a Map on Google Maps 2025 [New Method] Google Maps Secrets (New Update)
 0:12:31
Animate maps like Vox in Davinci Resolve
 0:14:16
FLOW MAP in Power BI | Insightful Map Visualizations Made Simple
 0:00:14
Animated RoadMap Template For PowerPoint | PowerPoint Animation
 0:00:22
Hike Safari Route Planner Wayfinding - Wigglepixel | Interactive Maps and Christmas Cards
 0:07:38
PowerPoint Animation Tutorial - Map Location
 0:14:28
Create Custom Google Maps (Complete) in Adobe Illustrator & Snazzy Maps (2025)
 0:01:00
Flight Route Map using Folium Python #shorts
 0:05:13
Custom Interactive Maps with the Google Maps API 13 Dealing with Multiple Events
 0:04:31
How to Plot Directions in Google Maps using Python | Route Plot | GMAPS
 0:00:18
Route visualization on the map
 0:06:05
Bring Your Maps to Life with Animated Maps in PowerPoint
 0:00:15
Cosplay by b.tech final year at IIT Kharagpur
Комментарии