filmov
tv
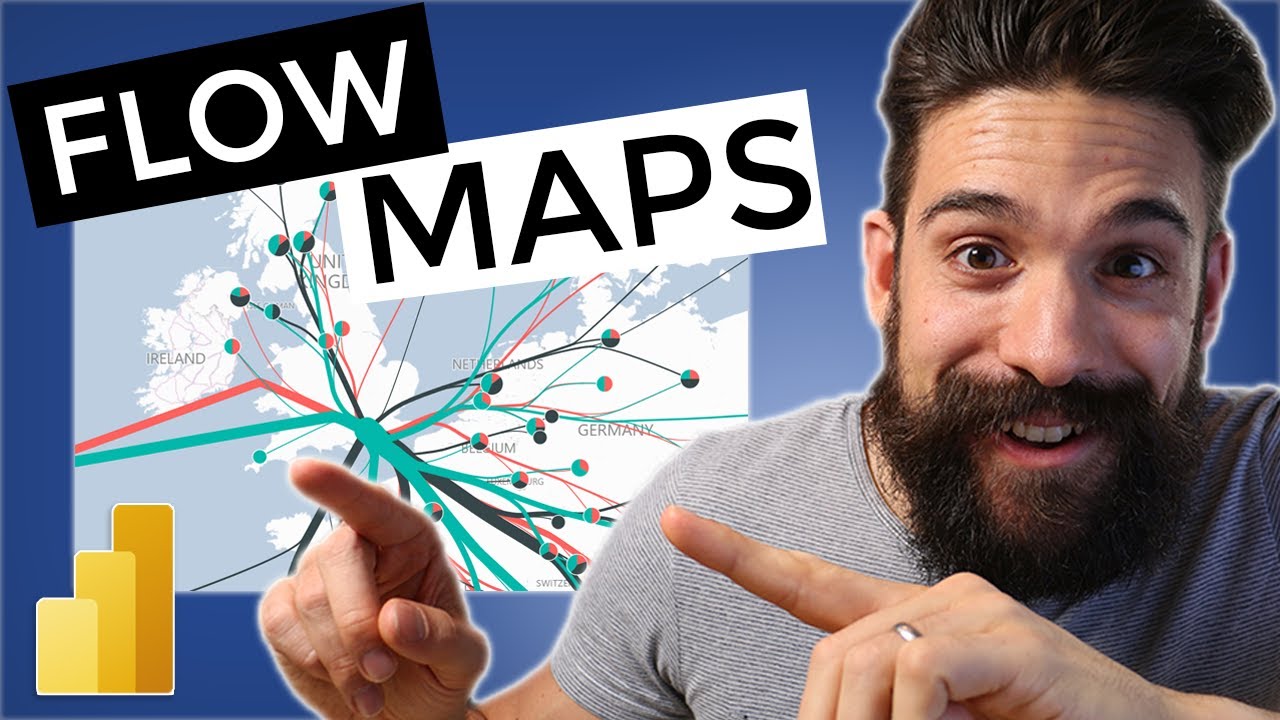
FLOW MAP in Power BI | Insightful Map Visualizations Made Simple
Показать описание
Power BI flow map let you visualize movement on a map when you have “source to target” information in your data. In this video I show how to quickly create insightful map visualizations in Power BI. This custom visual is great if you want to visualize flow in Power BI, for example: shipments volume between locations, migrations flows, or flight routes. I go over all of the key features and best practices so that you can get the most out of this custom visual. Enjoy!
--------------------------------
📊 TRAININGS 📊
---------------------------------
---------------------------------
⏱️ TIMESTAMPS ⏱️
---------------------------------
0:00 Intro
0:32 Creating a flow map
2:10 Visualisation styles for the flow map
3:20 Map elements
3:57 Map controls
4:41 Map legend
7:31 Line width
8:36 Line bubbles
9:11 Tooltip
11:08 Advanced flow map options
12:14 Using latitude and longitude
13:31 End
---------------------------------
😍 JOIN 😍
----------------------------------
---------------------------------
👇 CHECK THIS OUT! 👇
---------------------------------
* Above are affiliate links, which means at no additional cost to you, if you make a purchase using these links we will receive a small commission. It supports us and helps us to continue making more How to Power BI videos!
Thanks for being a part of this channel and all your support! 💪 🙏
#HowToPowerBI #PowerBI #DataTraining
#powerbidesktop #powerbitraining #powerbideveloper #DAX
 0:14:16
FLOW MAP in Power BI | Insightful Map Visualizations Made Simple
 0:13:15
Power BI Custom Visual - Flow Map
 0:10:30
Fix errors with Flow Map in Power BI
 0:09:17
Creating and Using Flow Maps in Power BI with Free Dataset
 0:09:53
Flow Map Power Bi
 0:02:50
Discover the Hidden Power of Flow Maps in Power BI
 0:00:15
Microsoft Power BI Data-Flow Diagram
 0:09:40
Flow Maps - Mapas 'Desde-Hacia'
 1:21:45
Learn Power BI | Beginners to Pro | Day 59 Reports in Power BI
 0:09:40
Incorrect MAP LOCATIONS in Power BI and how to fix it
 0:01:09
5.5 How to show flows and routes on the map? [Reporting on maps in Excel & Power BI | Free Cours...
 0:01:00
FLOW MAPS in Power BI #Shorts
 0:08:03
Master The Art Of Mapping In Power Bi: How to easily create Line Maps!
 0:20:52
Power BI Custom Visuals 📊- Route Map 🗺️
 0:06:56
Cómo usar gráficas en #Powerbi | Scroller y Flow maps
 0:04:05
FLOW MAPS - Understanding Maps without Code
 0:11:15
Power BI Custom Visuals - Hierarchy Chart by Akvelon
 0:49:58
Live044 Como criar mapa com cidade de origem e destino no Power BI | Flow Map
 0:10:13
Limit map points in Power BI Mobile report using Microsoft Flow
 0:17:40
Working with realtime datasets in Power BI and get location from Flow
 0:09:45
Arreglar errores de Flow Map en Power BI
 0:15:28
Cara Membuat Peta Distribusi di Excel Power BI Distribution Map | Flow Map on Power BI
 0:05:51
How to design a flow map for logistics with Excel Map?
 0:01:18
Flowchart vs. Process Map: What's the Difference? - PRIME BPM
Комментарии