filmov
tv
Linear Correlation 12 Meaning of Karl Pearson's Coefficient of Correlation

Показать описание
Statistics for all
MBA - MCA - CA - CS - CWA - BBA - BCA - BCom - MCom - GRE - GMAT - Grade 11 - Grade 12 - Class 11 - Class 12 - IAS - CAIIB - FIII - IBPS - BANK PO - UPSC - CPA - CMA - Competitive Exams - Entrance Exams
Linear Correlation (Correlation Analysis - Association between two variables)
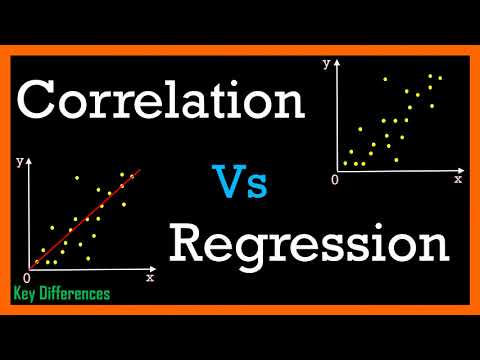
As we are now well aware that the age old Scatter Diagram Method of studying correlation is useful only in knowing whether the correlation between the two variables is 'positive' or negative' and 'perfect' or 'partial', but no statistical result can be obtained at the end.
Karl Pearson was of the opinion that there must be a statistical result at the end when we analyse the statistical data to study the correlation between two or more variables. The scatter diagram method fails in fulfilling this expectation, as it doesn't involve any calculation.
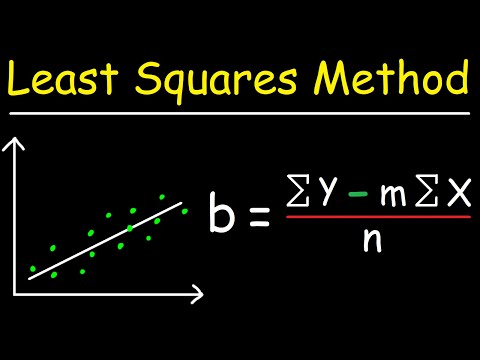
Karl Pearson developed the concept of 'Coefficient of Correlation' and derived the formula to calculate it.
What is 'Coefficient of Correlation"?
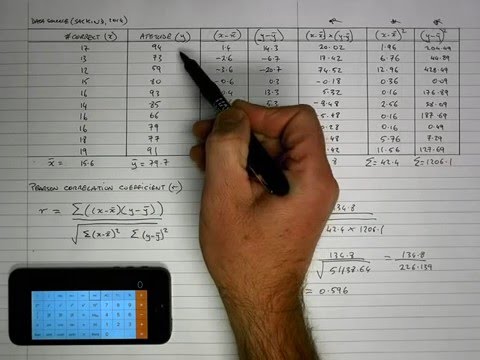
"Coefficient of Correlation is the ratio of Covariance of the two variables to the product of their standard deviations"
r = Cov (x, y) / SxSy
So, r = E[(X - E(X))(Y - E(Y))] / SxSy
So, r = ∑(X - Mean)(Y - Mean) / nSxSy
The value of 'r' lies always between '- 1 and + 1'
Thus, we obtain a statistical result at the end.
'r' can also be used for further calculations in regression analysis.
1) If 'r' is exactly +1, it shows perfect positive correlation. That means the variables change every time in the same direction with same rate.
2) If 'r' is exactly -1, it shows perfect negative correlation. That means the variables change every time in the direction opposite to each other but at a same rate.
3) If 'r' is between 0 and +1, it shows partially positive correlation. That means not every time but many a times the variables change in the same direction and the rate of change in the same direction is higher than the rate of change in the opposite direction.
4) If 'r' is between -1 and 0, it shows partially negative correlation. That means not every time but many a times the variables change in the direction opposite to each other and the rate of change in the opposite direction is higher than the rate of change in the same direction.
5) 'r' = 0 is a theoretical situation only. Practically, when we analyse statistical data, 'r' falls between -1 and +1, but not exactly 0. In some cases 'r' happens to be so near to zero that we can conclude as 'r' = 0 and there is no correlation between the variables. Whether the variables under study are correlated or not is the matter of understanding of the analyst and it should not be left upon the method of study.
MBA - MCA - CA - CS - CWA - BBA - BCA - BCom - MCom - GRE - GMAT - Grade 11 - Grade 12 - Class 11 - Class 12 - IAS - CAIIB - FIII - IBPS - BANK PO - UPSC - CPA - CMA - Competitive Exams - Entrance Exams
Linear Correlation (Correlation Analysis - Association between two variables)
As we are now well aware that the age old Scatter Diagram Method of studying correlation is useful only in knowing whether the correlation between the two variables is 'positive' or negative' and 'perfect' or 'partial', but no statistical result can be obtained at the end.
Karl Pearson was of the opinion that there must be a statistical result at the end when we analyse the statistical data to study the correlation between two or more variables. The scatter diagram method fails in fulfilling this expectation, as it doesn't involve any calculation.
Karl Pearson developed the concept of 'Coefficient of Correlation' and derived the formula to calculate it.
What is 'Coefficient of Correlation"?
"Coefficient of Correlation is the ratio of Covariance of the two variables to the product of their standard deviations"
r = Cov (x, y) / SxSy
So, r = E[(X - E(X))(Y - E(Y))] / SxSy
So, r = ∑(X - Mean)(Y - Mean) / nSxSy
The value of 'r' lies always between '- 1 and + 1'
Thus, we obtain a statistical result at the end.
'r' can also be used for further calculations in regression analysis.
1) If 'r' is exactly +1, it shows perfect positive correlation. That means the variables change every time in the same direction with same rate.
2) If 'r' is exactly -1, it shows perfect negative correlation. That means the variables change every time in the direction opposite to each other but at a same rate.
3) If 'r' is between 0 and +1, it shows partially positive correlation. That means not every time but many a times the variables change in the same direction and the rate of change in the same direction is higher than the rate of change in the opposite direction.
4) If 'r' is between -1 and 0, it shows partially negative correlation. That means not every time but many a times the variables change in the direction opposite to each other and the rate of change in the opposite direction is higher than the rate of change in the same direction.
5) 'r' = 0 is a theoretical situation only. Practically, when we analyse statistical data, 'r' falls between -1 and +1, but not exactly 0. In some cases 'r' happens to be so near to zero that we can conclude as 'r' = 0 and there is no correlation between the variables. Whether the variables under study are correlated or not is the matter of understanding of the analyst and it should not be left upon the method of study.
 0:02:24
 0:07:51
 0:12:57
 0:02:31
 0:04:07
 0:03:36
 0:04:51
 0:27:00
 0:26:51
 0:05:40
 0:19:01
 0:15:05
 0:09:26
 0:07:52
 0:41:45
![STD-12 STATISTICS [CHAPTER-2]](https://i.ytimg.com/vi/C0_J2EFEePY/hqdefault.jpg) 0:21:57
0:21:57
 0:05:12
 0:08:13
 0:10:01
 0:10:24
 0:22:29
 0:10:55
 0:05:35
 0:06:37