filmov
tv
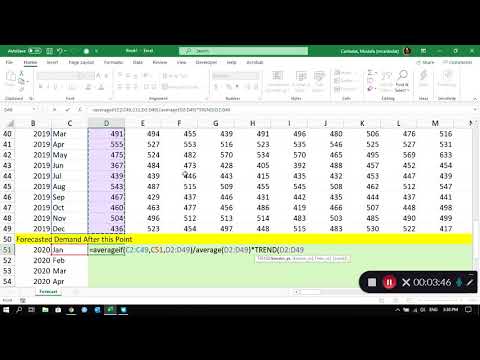
Monthly Sales Forecast with Seasonality and Trend - EXCEL regression with dummy variables

Показать описание
Welcome to our comprehensive tutorial on Monthly Sales Forecasting using Excel Regression with Dummy Variables, where we'll guide you through the intricacies of forecasting sales with both seasonality and trend. Whether you're a business analyst, data enthusiast, or just looking to enhance your Excel skills, this video is your gateway to mastering the art of accurate sales predictions.
📊 In this step-by-step tutorial, you'll learn:
1️⃣ The fundamentals of regression analysis in Excel, leveraging the powerful Data Analysis Tool Pack.
2️⃣ How to effectively capture and incorporate seasonality into your sales forecasts using dummy variables.
3️⃣ The importance of recognizing and accounting for trends in your data to make more accurate predictions.
4️⃣ A deep dive into Winter's Smoothing Method, demystifying this widely-used forecasting technique.
5️⃣ Practical tips and best practices to ensure your forecasts are reliable and actionable.
Sales forecasting is a critical aspect of business planning, helping you make informed decisions on inventory management, resource allocation, and overall business strategy. Whether you're dealing with historical sales data, financial planning, or simply want to gain a deeper understanding of predictive analytics, this tutorial will provide you with the knowledge and skills you need.
===== CHAPTERS =====
2:01 - Create the Dummy Variables
3:31 - The Regression tool in Excel's Analysis Tool pack
7:01 - Create the Regression Model
10:00 - Visualize with Excel Chart
#ExcelRegression #SalesForecasting #DataAnalysis #DummyVariables #WinterSmoothing #BusinessAnalytics #ExcelTutorial #DataScience #TrendAnalysis #SeasonalityForecasting #BusinessIntelligence
 0:11:21
Monthly Sales Forecast with Seasonality and Trend - EXCEL regression with dummy variables
 0:05:42
Forecasting in Excel Made SIMPLE (include seasonality & make predictions)
 0:13:32
Operations Management using Excel: Seasonality and Trend Forecasting
 0:09:34
Seasonality and Trend Forecasting Video 2: Multiple SKUs
 0:07:57
Forecast seasonality in Excel (EASY METHOD) | Excel Off The Grid
 0:07:10
How to Forecast the future values using Excel make predictions easily using excel
 0:02:28
How to Use Sale Forecast Function in MS Excel
 0:00:29
The Forecast.ETS Function
 1:46:44
Top 200 MCQ APICS CPIM 8.0 with Detailed Explanations 2024
 0:01:02
Calculate sales or inventory forecast in excel using historical data - 1 min video.
 0:13:21
How to perform Holt Winter's Method on Monthly Data (in Excel)
 0:15:46
Seasonality in Time Series: Integrate it into Demand Forecasting (Full Excel Tutorial)
 0:06:28
How to do multiple regression on Monthly Seasonal data in Excel
 0:05:09
Seasonally Adjusted Forecasting Using Microsoft Excel
 0:09:56
Building a Rolling Forecast in Excel
 0:22:47
Sales Forecast Regression XL
 0:05:31
The Excel FORECAST Function
 0:09:07
Forecasting Trend and Seasonality
 0:12:15
Deseasonalizing
 0:03:40
Seasonality without Trend | Regression | Seasonal Index | Forecasting | Dummy variables
 0:04:19
Regression with Dummy variables | Forecasting | Trend with Seasonality in Excel
 0:24:23
Forecasting Future Sales Using ARIMA and SARIMAX
 0:06:39
Forecasting Methods made simple - Seasonal Indices
 0:03:51
Forecasting | Forecast in Excel | Sales Forecasting | Forecast future values | Excel
Комментарии