filmov
tv
Dynamic MS Excel Sales Process Diagram | No Micros VBA | Tutorial #3

Показать описание
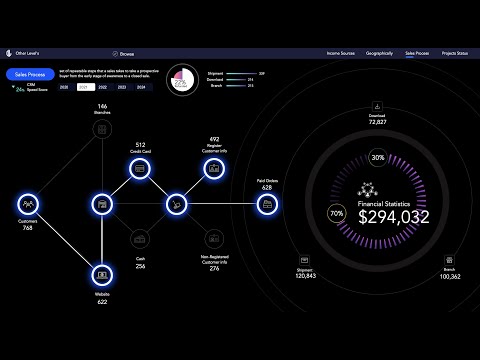
Financial Statistics Dashboards System - Dynamic Excel Dashboard
The first video tutorial is here!
Courses & Playlists:
0:00, Dashboards Overview
0:26, Creative Doughnut & Scatter chart
9:11, Sales process diagram layout
11:49, Highlights - luminous adjustments
21:07, Dynamic process diagram formula
24:22, Delivery Types Analysis (Amounts)
29:00, Delivery Types Analysis (Counts)
30:53, Refunded percentage - Pie Chart
33:50, General Notice
34:33, Dashboard Protection
35:02, Project's workflow report
With over 6 million views, our Excel Dashboard video tutorial is the #1 most-watched tutorial on YouTube!
Gain a comprehensive understanding of your financial performance with the Financial Statistics Dashboards System, a dynamic and visually engaging Excel Dashboard by Other Levels. Designed to simplify financial analysis, this tool transforms complex data into clear, actionable insights, making it indispensable for businesses and professionals managing finances.
This powerful dashboard features an interactive web chart that analyzes all sources of income in detail, highlighting the highest value contributor. A creative doughnut chart showcases progress toward financial targets, helping you stay focused on your goals. Track overall performance with metrics like total income, average monthly income, and monthly operating profits, all displayed in visually striking formats.
With detailed line and bar charts, monitor income trends by month and compare marketing strategy effectiveness, ensuring your financial strategies remain optimized. The dashboard also offers dynamic control through a year selection slicer, allowing you to customize and filter data effortlessly.
Whether you're a financial analyst, business owner, or decision-maker, this Excel Dashboard delivers critical insights with ease. Its intuitive design ensures accessibility, while its rich features empower you to make informed decisions, track progress, and optimize income sources efficiently.
Crafted for precision and performance, the Financial Statistics Dashboards System by Other Levels is the perfect solution for anyone seeking a deeper understanding of financial dynamics. Maximize your financial potential today with this high-performance tool designed for success.
Key Features
A Dynamic web chart analyse in detail all sources of income and the percentage of each source and highlights the source with the highest value.
A Creative Doughnut chart showing the achieved percentage from the target.
Dashboard title and description
Total Income amount and the target
A line chart Income by months
Total counts and percentage of Income Sources items.
Average of monthly income
A Bar chart showing the Monthly operating profits and the total amount
Analysing for two types of Marketing strategies.
All these values are controlled and changed based on the year selection of the slicer.
------------------------------------------------------------
Welcome to Other Level’s,
Your go to resource for unlocking the full potential of Microsoft Office.
Whether you're looking to enhance your skills in Excel, Word, PowerPoint, or data analysis, we simplify complex tools with clear, easy to follow tutorials.
Master Microsoft Office with Step by Step Tutorials and Expert Tips!
What sets us apart:
- Comprehensive breakdown of essential formulas, digital designs, and data visualization techniques.
- Straightforward, impactful videos focused on real world business applications.
- We create professional dashboards that help you elevate your productivity and projects.
- No unnecessary jargon just relevant content that helps you master Microsoft tools efficiently.
- Honest, relevant titles and thumbnails that reflect the value we deliver in every video.
Join us and transform the way you work with Microsoft Office.
Every second of our content is designed to help you succeed!
Copyright © 2025 Other Level's. All rights reserved.
"Any illegal reproduction of this content in any form will result in immediate action against the person concerned."
#Dynamic_Process_Diagram #Excel #Dashboard
 0:35:37
Dynamic MS Excel Sales Process Diagram | No Micros VBA | Tutorial #3
 0:00:16
Sales Dashboard in Excel
 0:44:50
Create Dynamic Sales Dashboard in Excel | With Voiceover
 0:06:30
'Sales pipeline management' Excel template with dashboard, stages, forecast, tools, and an...
 0:18:56
How to create a Simple Dashboard Report in Microsoft Excel
 0:00:20
How to Make INTERACTIVE Excel Dashboards - Step by Step Guide
 1:14:30
Is This Microsoft Excel?! Financial Statistics Dashboards System | Tutorial 1
 0:30:37
How to build Dynamic & Interactive Dashboard in EXCEL with Pivot Tables&Charts | Tutorial Ep...
 0:19:21
📊 How to Build Excel Interactive Dashboards
 0:00:15
Project Management dashboard in excel - Buy from https://bit.ly/Exceltemplate
 0:00:34
How to make a Pivot Table in 3 Steps‼️ #excel
 0:00:33
Excel FILTER Function
 0:00:28
Excel Filter Function: Filtering Top Grade Students
 0:00:55
How to Create a Pivot Table in Excel
 0:00:27
How to calculate monthly sale report in excel#exceltips #education #shortvideo
 0:00:56
Watch a MASTER closer in action…
 0:00:52
MS Excel - Macros - Automate your Spreadsheets in ONE CLICK!!
 0:00:18
Draw a Multiple Bar Diagram in Excel
 0:00:22
Excel vs Google Sheets
 0:00:54
Data Entry Form in Excel‼️ #excel
 0:06:26
How to Create a Funnel Chart in Excel (Sales funnel based on Excel data)
 0:00:10
SUM Formula in Excel | Add Total Values #shorts #excel
 0:00:54
Creating an Instant Dashboard in Excel A Step by Step Guide
 0:00:33
Excel VBA Macros: Data Entry Made Easy with These Tips and Tricks
Комментарии