filmov
tv
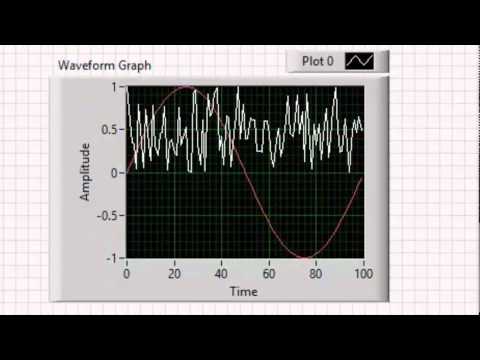
LabView WaveForm Graph

Показать описание
Shows how to use the waveform graph in LabView to graph a sine wave, with some control over the values on the x-axis.
 0:19:17
LabVIEW | Plot Data on Charts and Graphs in Different Ways
 0:03:18
Using Charts and Graphs in NI LabVIEW
 0:07:00
VI High 64 - Multiplot Displays on LabVIEW Waveform Charts and Waveform Graphs
 0:05:13
VI High 65 - How to Change Timing on a LabVIEW Waveform Graph
 0:06:40
VI High 63 - What's the Difference Between LabVIEW Waveform Charts and Waveform Graphs?
 0:03:27
Waveform graph in LabVIEW
 0:17:51
Set Properties of Charts and Graphs in LabVIEW
 0:10:08
2-01 Tutorial Labview - waveform graph vs. waveform chart
 0:20:12
Waveform Chart and Waveform Graph - LabVIEW 2019
 0:03:53
Sine Wave Graph in Labview.mp4
 0:09:36
LabView WaveForm Graph
 0:10:42
Two signals in waveform graph (LabVIEW)
 0:03:36
LabVIEW Getting Started with Graphs and Charts
 0:10:43
Waveform Graph example in LabVIEW
 0:08:04
Waveform Chart Example in LabVIEW
 0:04:38
Labview Waveform Graph (46)
 0:02:47
Labview Examples: Waveform Graph
 0:09:25
Waveform Graph en LabVIEW
 0:05:45
Getting Started with LabVIEW, 1.10 Customizing a Waveform Graph
 0:14:55
Current Date and Time in Waveform Graph & Chart
 0:02:33
LabVIEW - Waveform Chart y Waveform Graph
 0:03:32
To study the properties of charts and graph using LabVIEW
 0:02:15
LabVIEW CLAD 038 Waveform Graph
 0:00:16
LabVIEW TASK part A visualize random data using waveform chart and waveform graph
Комментарии