filmov
tv
LabVIEW | Plot Data on Charts and Graphs in Different Ways

Показать описание
#Charts #XYGraphs #LabVIEW
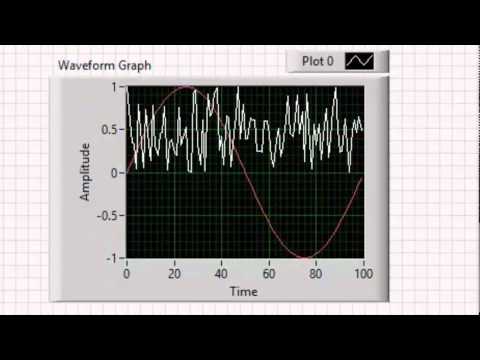
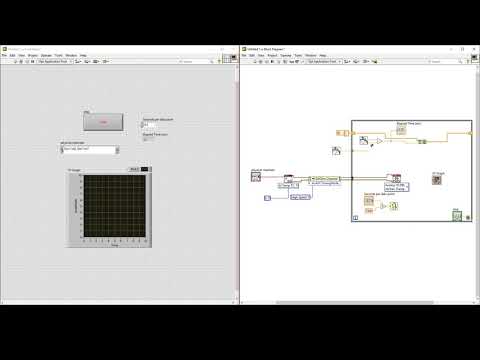
This is the video for LabVIEW beginners, in this video I have tried to plot data using random number generator on Waveform charts, Graphs, XY graphs. I used automatic index mode, bundle function, express XY graph functions to manipulate the data representation on graphs in LabVIEW.
If you need help in your projects, contact me:
 0:19:17
LabVIEW | Plot Data on Charts and Graphs in Different Ways
 0:21:00
Plot Data on Different 3D Graphs in LabVIEW
 0:03:58
Graph plotting in LabVIEW
 0:22:12
LabVIEW Plotting
 0:17:51
Set Properties of Charts and Graphs in LabVIEW
 0:03:03
How to plot multiple graphs in a single plot - LabVIEW
 0:09:51
Plotting XY Graphs and Linear Regression in LabVIEW
 0:10:43
Excel to LabVIEW - Plot values from excel in labview
 0:04:31
Plot XY in labview
 0:10:05
LabVIEW | 2D Graph Plotting
 0:02:05
LabVIEW - XY Graph
 0:05:13
VI High 65 - How to Change Timing on a LabVIEW Waveform Graph
 0:07:00
VI High 64 - Multiplot Displays on LabVIEW Waveform Charts and Waveform Graphs
 0:04:31
Import .CSV file in LabVIEW and Draw Multiple Line Graph and Find Slope of Each Line
 0:08:42
Detect/count peaks from Signals and plot on graph in LabVIEW
 0:03:36
LabVIEW Getting Started with Graphs and Charts
 0:29:49
NI-DAQmx multi-channel data acquisition LabVIEW program
 0:11:47
Load and visualize .csv data in LabVIEW
 0:08:58
Graph and Chart Controls and Indicators in LabVIEW
 0:03:32
To study the properties of charts and graph using LabVIEW
 0:06:22
How to reinitialize XY Graph in LabVIEW
 0:34:32
Plotting in LabVIEW
 0:08:04
Waveform Chart Example in LabVIEW
 0:05:38
Origin 8: Use Origin with LabVIEW for Real time DAQ Data Analysis
Комментарии