filmov
tv
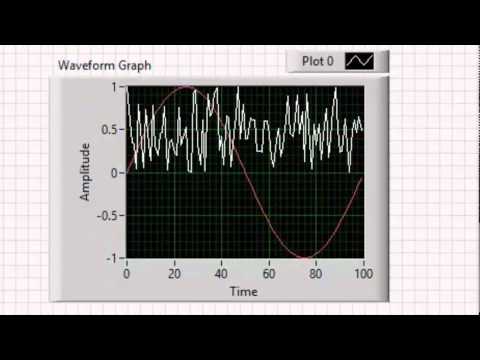
VI High 64 - Multiplot Displays on LabVIEW Waveform Charts and Waveform Graphs

Показать описание
We're in episode 2 of a 4-part series on Waveform Charts, Waveform Graphs, and XY Graphs in LabVIEW. Today we look at making multiplot displays with Waveform Charts and Graphs.
 0:07:00
VI High 64 - Multiplot Displays on LabVIEW Waveform Charts and Waveform Graphs
 0:03:04
Multiplot
 0:05:27
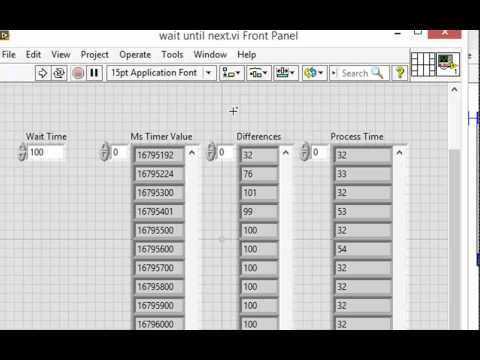
VI High 60 - Comparing the Wait and the Wait Until Next Ms Multiple
 0:05:13
VI High 65 - How to Change Timing on a LabVIEW Waveform Graph
 0:08:47
VI High 61 - Understanding Numeric Representation, Integer Overflow, and Fractional Values
 0:03:03
How to plot multiple graphs in a single plot - LabVIEW
 0:07:14
Oversampling and Filtering in Labview.mp4
 0:05:39
Multiple Signals in a Chart
 0:19:17
LabVIEW | Plot Data on Charts and Graphs in Different Ways
 0:06:08
VI High 57 - How to Pass Data Between States in a LabVIEW State Machine - pt 2
 0:35:18
labview freq response demo 5 square waves and summation of signals vi
 0:02:41
LabVIEW procedure: Bind a PC VI front-panel indicator to a network-published shared variable (NPSV)
 0:00:16
LabVIEW sine wave in radians
 0:08:59
Lab2 Part B-Slope vi
 0:07:05
Lab2 Part A-Slope vi
 0:00:14
Labview diode karakteristiek
 0:05:14
Circle using X Y graph
 0:00:08
Assignment 4 - Waveform Generation
 0:00:24
Graf Cursor
 0:05:27
Data Display in Graph in Flex Logger | Flex Logger Tutorial -06
 0:09:36
PAM subVI: pam_TransmitFilter.vi coding tips
 0:20:12
Waveform Chart and Waveform Graph - LabVIEW 2019
 0:03:54
How to Set Revision History Options for the Current VI in LabVIEW
 0:00:50
Polymorphic VI Editor Scroll When Dragging Terminal - 2018-03-07
Комментарии