filmov
tv
Market Capitalization: Excel Analysis & S&P 500 Returns

Показать описание
In this video, I dive deep into Market Capitalization, demonstrating how to use Excel for stock analysis and exploring the potential of long-term S&P 500 returns. Whether you're a finance enthusiast or just curious about stock market metrics, this tutorial offers valuable insights and practical Excel techniques.
Learn how to leverage Excel's stock data type to quickly analyze company financials, understand market capitalization categories, and see how compound interest can potentially grow your investments over time. I also explain the Rule of 72 and provide insights into the actual composition of the S&P 500 index.
Chapters:
00:00 - Introduction
01:15 - What is Market Capitalization?
02:30 - Excel Stock Analysis Feature
05:45 - Calculating Market Cap in Excel
07:30 - S&P 500 Year-to-Date Returns
09:00 - Compound Interest Simulation
11:15 - Future Value Function in Excel
12:30 - Rule of 72 Explanation
13:45 - S&P 500 Composition Insight
-- EQUIPMENT USED ---------------------------------
-- SOFTWARE USED ---------------------------------
DISCLAIMER: Links included in this description might be affiliate links. If you purchase a product or service with the links I provide, I may receive a small commission. There is no additional charge to you! Thank you for supporting my channel, so I can continue to provide you with free content each week!
 0:13:41
Market Capitalization: Excel Analysis & S&P 500 Returns
 0:05:48
Get any STOCK DATA you want using EXCEL ONLY | STOCKHISTORY FUNCTION
 0:03:23
Market Cap Explained Under Four Minutes
 0:24:03
Capital market line explained: Tangency and CAPM derivation (Excel)
 0:07:18
Learn how to Create Index charts in Excel to compare data
 0:08:28
Market Capitalization explained
 0:49:11
Valuation Modeling: Excel as a tool
 0:03:55
MS Excel Pull Stock Prices automatically into Excel
 0:15:12
Multi Linear Regression Analysis in Excel: Analyzing the selling price of the car
 0:14:43
How To Calculate Intrinsic Value (AMZN Stock Example + Excel Template)
 0:07:23
How To Calculate Market Share in Excel
 0:09:47
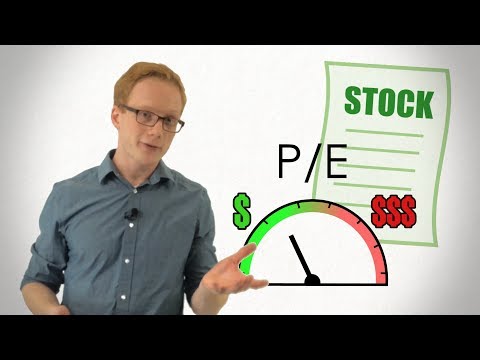
Stock Multiples: How to Tell When a Stock is Cheap/Expensive
 0:29:38
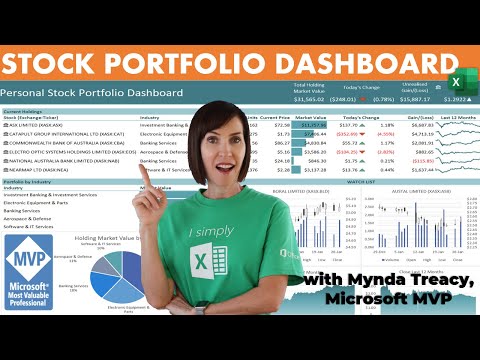
LIVE Stock Portfolio Dashboard in Excel in 30 Minutes!
 0:07:24
How to track NSE Stocks on Google Sheets? | Real-time Stock Price | Google Finance | Trade Brains
 0:00:45
Market Capitalization is one way to measure the size of a company
 0:27:06
Excel Stock Portfolio Dashboard - FREE File Download
 0:07:36
Stock Data and STOCKHISTORY Function in Excel 365 and Excel 2019
 0:06:10
Financial Statement Analysis #6: Ratio Analysis - Market Value Measures
 0:10:41
Data-Driven Trading in Stock Market: Excel Mastery with Premium Insights! | Vivek Bajaj
 0:04:17
Book Value vs Market Value Balance Sheet: Simple Example Using Excel
 0:13:11
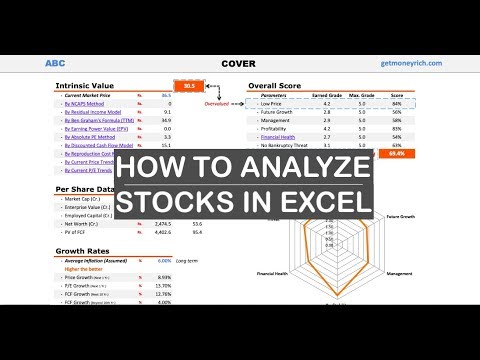
How to Analyze Stocks in Excel?
 0:01:13
Market Value Ratio - Market-to-Book Ratio
 0:08:46
Capital market line with constraints using Solver (Excel)
 0:04:01
How To Use Live Crypto Data In Excel
Комментарии