filmov
tv
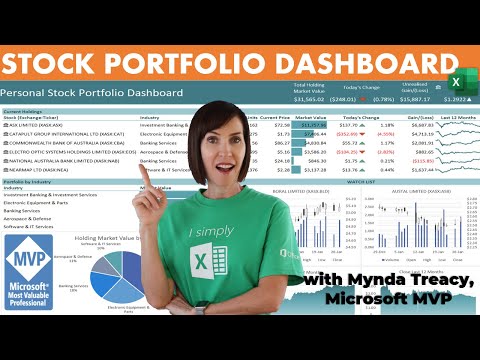
LIVE Stock Portfolio Dashboard in Excel in 30 Minutes!

Показать описание
Looking to master your stock portfolio management in Excel? In this easy-to-follow guide, "LIVE Stock Portfolio Dashboard in Excel in 30 Minutes!", we cover everything you need to know to set up a real-time stock portfolio tracker. From creating a transaction log and calculating returns to breaking down sector and market cap allocations with beautiful pie charts, this tutorial is your go-to resource for all things investing and Excel. Whether you're a novice or seasoned investor, this video will equip you with the tools to calculate gains, losses, dividends, and more, all in a live, up-to-date Excel dashboard.
👉 CORRECTION: I made one mistake @15:03. C4 in the denominator (# of shares purchased), should actually be E4 (# of shares sold). You should also remove the double quotes ,"") at the end of the IF statement from that same formula.
👨💼 My Freelance Financial Modeling Services:
Chapters:
0:00 – Overview of the Live Stock Dashboard in Excel
0:39 – Create a Transaction Log
2:47 – Begin Constructing Portfolio Dashboard
4:11 – Retrieve the Sector of Each Stock in the Portfolio
4:46 – Find the Market Cap Size of Each Company
6:22 – Calculate the Percentage Allocated to Each Share
8:22 – Retrieve the Beta of Each Stock
9:13 – Calculate Today’s Return on Each Share
10:31 – Calculate Average Purchase Price Per Share
14:22 - Calculate Average Sale Price Per Share
15:24 – Calculate Total Dividends Received
16:45 – Calculate Realized Gain or Loss on Each Stock
17:37 – Calculate Total Gain or Loss on Each Stock
18:30 – Calculate Unrealized Gain or Loss on Each Stock
19:52 – Calculate Total Portfolio Gains and Losses
22:45 – Conditionally Format Gains & Losses
23:44 – Create Market Cap Size Pie Chart
26:33 – Create Sector Allocation Pie Chart
27:29 – Create Individual Securities Holdings Pie Chart
*Disclosure: This is not financial advice and should not be taken as such. The information contained in this video is an opinion. Some of the information could be wrong. This channel is owned and operated by Portfolio Constructs LLC
 0:29:38
LIVE Stock Portfolio Dashboard in Excel in 30 Minutes!
 0:27:06
Excel Stock Portfolio Dashboard - FREE File Download
 0:22:51
Build Your Own Portfolio Dashboard Tracker in 20 Minutes! (Portfolio Tracker in Google Sheets)
 0:42:43
Stock Portfolio Dashboard | Google Sheets Dashboard | BI Dashboard | Step-by-Step Tutorial
 0:29:41
FREE Portfolio Dashboard With Live Update in Google Sheets!
 0:56:00
Build Your Own Portfolio Tracker | Crypto, Stocks, & ETFs All In One Place!
 0:13:59
Get Latest Stock Data in Excel & Create Your Own Stock Portfolio
 0:08:13
01 Stock Portfolio - Dashboard in Excel | Part 1 - Overview
 9:47:31
♉ Make money online ▪ Etoro Live Stock Market ▪ Gold At Historical Highs. @TorosAmado
 0:25:59
Build A Fully Functioning STOCK WATCHLIST With Live Data In Google Sheets
 0:19:11
How To Build Your Own Stock Portfolio Tracker Dashboard For FREE
 0:22:35
Stock Market Dashboard | With Advanced & Dynamic line chart indicator | Video Tutorial #1
 0:06:30
How To Create A Crypto Portfolio Dashboard In Excel
 1:06:25
Build Your Own Stock Portfolio Tracker On Google Sheets
 0:47:18
How to Create a Day Trading Tracker in Google Sheets (Step by Step)
 0:29:51
Track your cryptocurrency portfolio in an Excel Spreadsheet, with live pricing data
 0:26:09
Stock Portfolio Tracker - Google Sheets Spreadsheet Tutorial (Step-by-Step with Code)
 0:39:52
How to Create a Portfolio Dashboard in Google Sheets! (Step by Step)
 0:30:37
How to build Dynamic & Interactive Dashboard in EXCEL with Pivot Tables&Charts | Tutorial Ep...
 0:15:38
How To Make a Stock Portfolio Dashboard on Webull Desktop
 0:26:29
How To Make A Stock Watchlist In Google Sheets | Automated dashboard | SG Trader
 0:11:47
Auto Update Portfolio in Google Sheet - Vivek Singhal
 0:43:53
Sales Dashboard in Excel | Dynamic Excel Dashboard for Sales
 0:03:00
Stock Portfolio Dashboard Preview | Share Market Dashboard in Excel
Комментарии