filmov
tv
How To Insert Progress Chart in To Do List In Excel

Показать описание
How To Insert Progress Chart in To Do List in Excel
First you need to create your To-Do list. Now you need to find out total task, completed task, completion percentage and remaining percentage. I’ve done these using formula.
Here is how:
Calculate Total Task: The formula for this is =CountA(A2:A50) This will count total task by counting total used cell inside this range.
Completed Task: I’ve used the following formula to count the completed task. =CountIF(B2:B50, TRUE) this formula will count if the checkbox is clicked and count as completed project.
Completed Percentage: The formula is Completed Task/ Total Task and then format the cell as %
Remaining Percentage: The formula I used here is 1-Completed percentage.
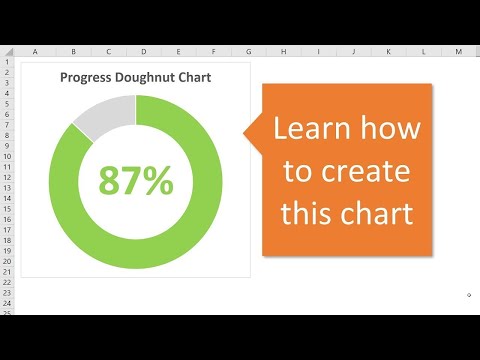
Once you have prepared your data then select the Competed and remaining percentage data and then click on insert and then from the chart dropdown select Doughnut chart. Now format the chart just like I’ve done in the video. This is how you create a progress bar chart in excel.
#Progress #Chart #Excel
Thanks for watching.
-------------------------------------------------------------------------------------------------------------
Support the channel with as low as $5
-------------------------------------------------------------------------------------------------------------
Please subscribe to #excel10tutorial
Here goes the most recent video of the channel:
Playlists:
Social media:
First you need to create your To-Do list. Now you need to find out total task, completed task, completion percentage and remaining percentage. I’ve done these using formula.
Here is how:
Calculate Total Task: The formula for this is =CountA(A2:A50) This will count total task by counting total used cell inside this range.
Completed Task: I’ve used the following formula to count the completed task. =CountIF(B2:B50, TRUE) this formula will count if the checkbox is clicked and count as completed project.
Completed Percentage: The formula is Completed Task/ Total Task and then format the cell as %
Remaining Percentage: The formula I used here is 1-Completed percentage.
Once you have prepared your data then select the Competed and remaining percentage data and then click on insert and then from the chart dropdown select Doughnut chart. Now format the chart just like I’ve done in the video. This is how you create a progress bar chart in excel.
#Progress #Chart #Excel
Thanks for watching.
-------------------------------------------------------------------------------------------------------------
Support the channel with as low as $5
-------------------------------------------------------------------------------------------------------------
Please subscribe to #excel10tutorial
Here goes the most recent video of the channel:
Playlists:
Social media:
 0:00:54
Excel tip for progress chart percent
 0:04:58
How To Insert Progress Chart in To Do List In Excel
 0:00:32
Progress Bars in Excel‼️ #excel #exceltips #exceltutorial
 0:10:31
Progress Circle Chart in Excel as NEVER seen before!
 0:00:56
Excel | progress chart | dounut graph with check box #pivot #exceltutorial #design #exceltutorial
 0:00:32
Progress Data Bar MS Excel-(V063)
 0:03:13
Creating a Dynamic Progress Chart in Google Sheets: Step-by-Step Tutorial
 0:01:47
How to Create Progress Bars in MS Excel with Conditional Formatting
 0:15:08
Gantt Charts for Agile Project Management 🏃 Excel vs. MS Project, Primavera P6, Trello & ClickUp...
 0:00:55
Create progress bar in excel with percentage - Excel Tips and Tricks
 0:00:27
How to Make Progress Bar with Checkbox in Excel? #excel #mexcel #excelsolutions
 0:00:58
Quick Excel Mastery: Progress Circle Charts in Just 60 Seconds!
 0:05:56
How to Create Modern PROGRESS CHART in Excel | Edcelle John Gulfan
 0:00:38
How to create Progress bar based on Checkbox in Excel
 0:12:29
Infographics: Progress Circle Chart in Excel
 0:07:11
Progress Circle Chart in Excel - Part 1 of 2
 0:10:48
Progress Circle Chart Infographics in Excel Dashboard
 0:00:35
Progress Charts in Excel! 8 Types That Will Help You Get Ahead
 0:07:16
How To Create A Gantt Chart With A Progress Bar To Show Percentage Completion Of Tasks In Excel
 0:09:40
Excel Tutorial: Dynamic Progress Bars with Checkboxes & Conditional Formatting
 0:03:21
How to Make Progress Chart in Excel | Progress Circle Chart in Excel
 0:00:54
MAKE a Progress Bar Chart in Excel LIKE a PRO in 2024!
 0:12:34
How to Create a Progress Circle Chart in Excel - Dynamically Display Percentage of Completion
 0:13:18
How to Create Dynamic Progress Circle Charts in Excel
Комментарии