filmov
tv
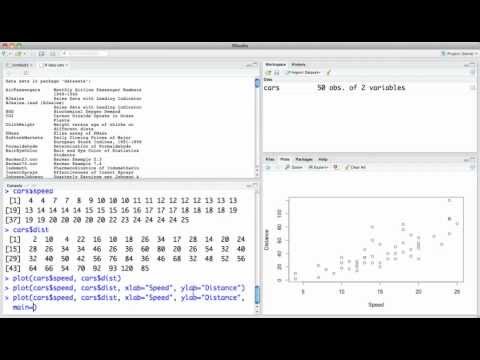
R Statistical: Plotting Pairs of Data

Показать описание
R provides a really simple way to look at relationships between all the pairs of variables in your dataset.
 0:01:14
R Statistical: Plotting Pairs of Data
 0:26:51
ggplot for plots and graphs. An introduction to data visualization using R programming
 2:10:39
R Programming Tutorial - Learn the Basics of Statistical Computing
 0:04:42
R Tutorial: Plotting multivariate data
 0:18:11
Visualize your data using ggplot. R programming is the best platform for creating plots and graphs.
 0:05:46
Draw Two Data Sets with Different Sizes in ggplot2 Plot in R (Example) | Point Size in Scatterplot
 0:07:19
How to plot graphs using Excel csv data in R studio
 0:06:39
Box-Plot (Simply explained and create online)
 1:10:47
Part 1/2 of lecture on Chapter 1 of Introduction to Bayesian Data Analysis for Cognitive Science.
 0:04:43
Scatter Plot Matrix in R - Create and Interpret
 0:05:02
Introduction to Plotting in R
 0:07:09
Science of Data Visualization | Bar, scatter plot, line, histograms, pie, box plots, bubble chart
 0:08:09
How to Plot Statistical Group Comparisons in R: ggstatsplot
 0:17:26
Using ggplot to create bar charts for 2 categorical variables. R programming for beginners.
 0:07:22
R Studio: Importing & Analyzing Data
 0:05:35
Bland-Altman Plot [Simply explained]
 0:01:24
R Programming - Plotting Scatterplots
 0:03:45
Violin Plot [Simply explained]
 0:26:53
t-test and interpreting p values using R Programming
 0:00:15
Memorization Trick for Graphing Functions Part 1 | Algebra Math Hack #shorts #math #school
 0:07:27
Parallel Plot Data Visualization using R , plotting performance data
 0:25:39
Explore your data using R programming
 0:00:39
What is the XY Scatter Plot | #Statistics #LeanSixSigma #OpEx #SixSigma #ASQGreenBelt #CSSGB
 0:03:18
How to Make a Scatter Plot Matrix in R
Комментарии