filmov
tv
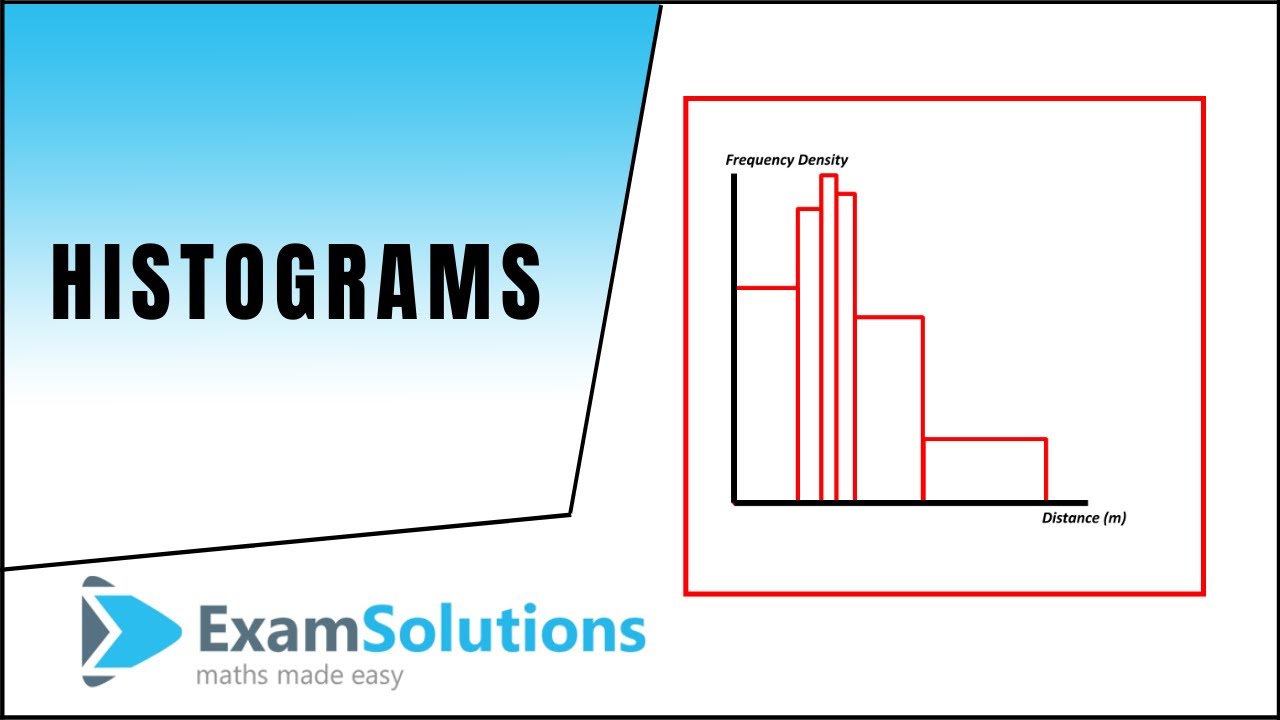
Histograms : ExamSolutions
Показать описание
In this video, I show you how to calculate frequency density and draw a histogram from the data.
PREDICTIVE GRADES PLATFORM
☑️ Accurate grade predictions
☑️ Personalised resources and tuition
☑️ Guaranteed results or get your money back
SIGN UP FOR A 7-DAY FREE TRIAL, THEN 20% OFF.
ONLINE COURSES AT:
PREDICTIVE GRADES PLATFORM
☑️ Accurate grade predictions
☑️ Personalised resources and tuition
☑️ Guaranteed results or get your money back
SIGN UP FOR A 7-DAY FREE TRIAL, THEN 20% OFF.
ONLINE COURSES AT:
 0:08:51
Histograms : ExamSolutions
 0:03:09
GCSE Edexcel June 2022 Higher Paper 3 Q17 - Histograms | ExamSolutions
 0:13:01
Interpreting histograms | GCSE Maths Level 5-9 | ExamSolutions
 0:03:43
A-Level Edexcel Statistics S1 January 2008 Q3 (Histograms) : ExamSolutions
 0:06:20
Histogram : S1 Edexcel January 2013 Q5(a) : ExamSolutions Statistics Revision
 0:02:57
Histogram - skewness : S1 Edexcel June 2012 Q5(d)(e) : ExamSolutions Maths Videos
 0:08:51
Mean in a histogram : S1 Edexcel June 2012 Q5(a)(b) : ExamSolutions Maths Videos
 0:42:22
GCSE Maths Workout (3) | ExamSolutions
 0:02:55
Edexcel Statistics S1 January 2012 Q1a : ExamSolutions
 0:01:14
GCSE Maths EDEXCEL Higher Specimen Paper 1 Q22 Histograms
 0:02:39
Edexcel Statistics S1 January 2012 Q1b : ExamSolutions
 0:12:50
Histograms | A-level Maths | OCR, AQA, Edexcel
 0:16:32
Histogram and calculation of mean (Step by step Exam Solutions)
 0:01:55
GCSE Maths AQA Higher Specimen Paper 2 - Q22 Histograms
 0:02:46
Edexcel Statistics S1 January 2012 Q6b,c,d : ExamSolutions
 0:02:40
Edexcel Statistics S1 January 2012 Q2b : ExamSolutions
 0:11:20
Histogram 2Step By Step Exam Solutions
 0:04:36
A-Level Edexcel Statistics S1 June 2010 Q1 : ExamSolutions
 0:06:49
A-Level Edexcel Statistics S1 June 2010 Q5a,b : ExamSolutions
 0:01:07
Edexcel Statistics S1 January 2012 Q2a : ExamSolutions
 0:03:50
Edexcel Statistics S1 June 2011 Q1d : ExamSolutions
 0:06:42
Median in a histogram | Edexcel S1 June 2012 Q5(c) | ExamSolutions
 0:01:52
Tudor Hall Maths Statistics Histograms
 0:03:44
Probability Tree Diagrams : S1 Edexcel June 2012 Q7(d) : ExamSolutions Maths Videos
Комментарии