filmov
tv
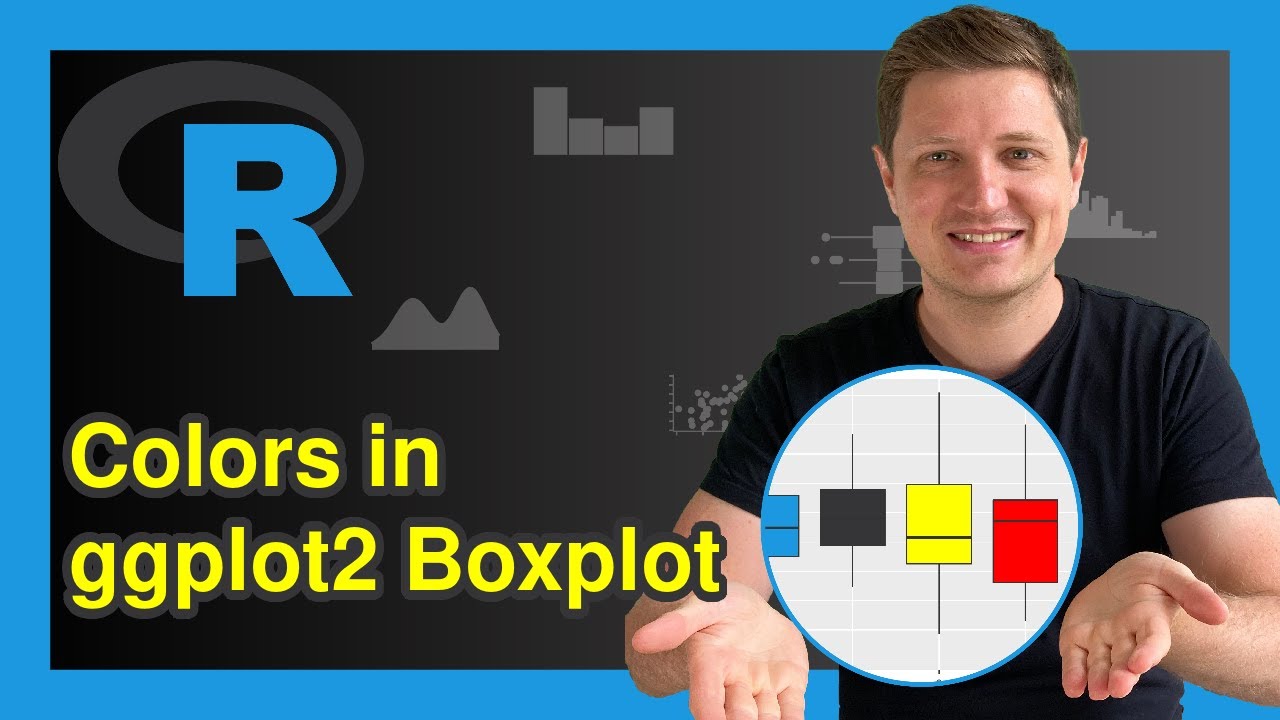
Change Color of ggplot2 Boxplot in R (3 Examples) | Set col & fill in Plot | Manually Specify Colors
Показать описание
R code of this video:
group = letters[1:5])
library("ggplot2")
ggplot(data, aes(x = group, y = value)) + # ggplot2 boxplot without colors
geom_boxplot()
ggplot(data, aes(x = group, y = value, col = group)) + # Change color of borders
geom_boxplot()
ggplot(data, aes(x = group, y = value, fill = group)) + # Change filling color
geom_boxplot()
ggplot(data, aes(x = group, y = value, fill = group)) + # Manually specified filling color
geom_boxplot() +
scale_fill_manual(breaks = data$group,
values = c("#1b98e0", "#353436", "yellow", "red", "green"))
Follow me on Social Media:
 0:04:30
Change Color of ggplot2 Boxplot in R (3 Examples) | Set col & fill in Plot | Manually Specify Co...
 0:00:54
R : How to change ggplot2 boxplot color with points
 0:07:15
Ggplot Colors - how to use colors effectively when creating plots with ggplot2
 0:03:44
Change Fill and Border Color of ggplot2 Plot in R (Example) | Modify Colors | scale_fill_manual()
 0:19:49
Using the the ggplot2 R package to create a boxplot with individual data points overlayed (CC091)
 0:03:41
ggplot2 Title & Subtitle with Different Size & Color in R (Example) | theme & element_te...
 0:05:51
Set Color by Group in ggplot2 Plot in R | Modify Colors of Single & All Geoms | scale_color_manu...
 0:09:37
Creating box plot in R usnig ggplot2 (in English Language)
 0:04:20
Guide to ggplot Colors: Working with Manual Color Scales for Categorical Data
 0:09:04
ggplot2: data visualization using boxplots
 0:03:41
Plotting in R using ggplot2: Create custom color palettes (Data Visualization Basics in R #25)
 0:04:26
Guide to ggplot Colors: Static vs. Mapped Colors
 0:04:58
Change y-Axis Limits of Boxplot (2 Examples) | Base R & ggplot2 Graph | coord_cartesian() Functi...
 0:23:50
Four ways to set a color in R using ggplot2 and how to read hexadecimal (CC139)
 0:05:05
Extract Default Color Palette of ggplot2 in R (Example) | How to Identify Hex Codes | scales Package
 0:02:39
How to Add Color to a Scatterplot Using ggplot2 in R. [HD]
 0:09:35
ggplot basics, creating scatterplot in colors, smooth, facet
 0:15:54
How to create a dodged bar plot and change filled colours using ggplot2 ? [R Tutorial 6.0 (a)]
 0:04:35
Change Continuous Color Range in ggplot2 Plot in R (Example) | Adjust Palette | colorRampPalette()
 0:01:38
Plotting in R using ggplot2: Remove background color in plots (Data Visualization Basics in R #23)
 0:05:05
Change Color of ggplot2 Facet Label Background & Text (3 Examples) | strip.background & stri...
 0:03:23
How to make your own color palettes in ggplot
 0:02:54
How to Make Boxplots in R
 0:04:27
Reorder Boxplot in Base R & ggplot2 (2 Examples) | Change Ordering | Reorder Factor Levels of Da...
Комментарии