filmov
tv
Excel bar chart with conditional formatting based on MoM change %

Показать описание
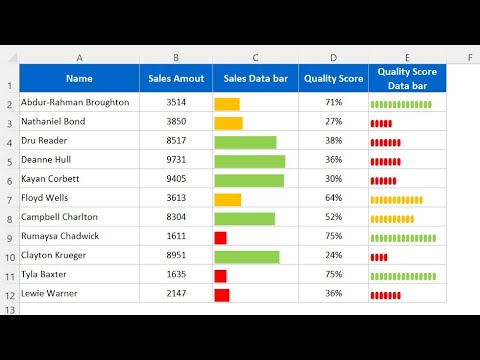
Can conditional formatting be applied to an Excel bar chart based on criteria that does not include the values? Yes it can, and this video shows you how.
In this video I show you how to create an Excel bar chart with conditional formatting based on the month over month change in the values instead of the values themselves. I also show how to create a custom data label that includes the value, the change, and an indicator icon. In the video I am using Excel 365 on Windows 10, and most modern versions of Excel will look very similar. If you like the video, please subscribe to the channel and add a comment below.
In this video I show you how to create an Excel bar chart with conditional formatting based on the month over month change in the values instead of the values themselves. I also show how to create a custom data label that includes the value, the change, and an indicator icon. In the video I am using Excel 365 on Windows 10, and most modern versions of Excel will look very similar. If you like the video, please subscribe to the channel and add a comment below.
 0:05:23
Conditional formatting for Excel column charts
 0:10:23
Simple Excel Trick to Conditionally Format Your Bar Charts
 0:01:31
How to Make a Graph Change Color Based on Value | Conditionally Formatting Charts
 0:05:56
TECH-013 - Create a bar chart with conditional formatting in Excel
 0:01:47
How to Create Progress Bars in MS Excel with Conditional Formatting
 0:13:49
Bar chart with differences in Excel
 0:09:52
Create A Column Chart That Shows Percentage Change In Excel - Part 1
 0:05:58
How to Create a Clustered Bar Graph With Multiple Data Points on Excel
 0:45:34
Power BI Demo Video On 2nd December 2024.Call/WhatsApp us on +91-9133190573 to Enroll
 0:06:00
Progress Bar in Excel Cells using Conditional Formatting
 0:01:06
How to Add Individual Error Bars in Excel
 0:12:27
How to Create Variance Charts in Excel with Percentage Change (simple & uncommon technique)
 0:17:11
This Excel Chart will grab your attention (Infographic template included)
 0:09:49
How to use Conditional formatting in Excel Chart
 0:12:55
Excel Conditional Bar Chart with Drop-down & Icons (This Chick's Trouble for Excel Hash)
 0:06:20
Excel In-Cell Charts
 0:09:53
Create Chart with Broken Axis and Bars for Scale Difference - Simple Method
 0:16:25
Build Impressive Charts: It's NOT your usual Bar Chart (Infographics in Excel)
 0:08:02
How to Change Individual Bar Color in Excel | How to Change Color of One Bar in Excel Chart
 0:14:11
Conditional Formatting in Multiple batteries Graph in Excel
 0:05:27
Excel Visualization | How To Combine Clustered and Stacked Bar Charts
 0:11:33
Get Ahead With These 10 Advanced Excel Charts!
 0:08:39
Highlight Max & Min Values in an Excel Line Chart (Conditional Formatting in Charts)
 0:08:07
Multi-color Data bar with REPT function in Excel
Комментарии