filmov
tv
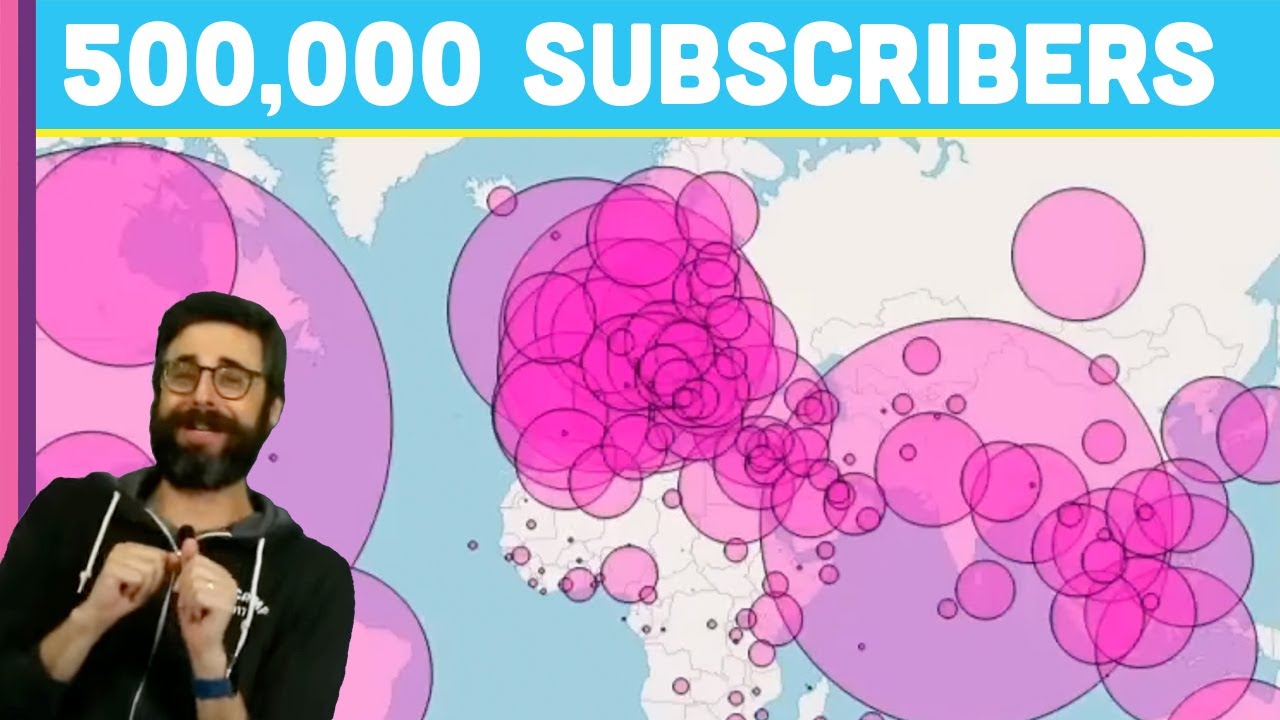
Coding Challenge #109: Visualizing 500,000 Subscribers
Показать описание
References:
Live Stream Archive:
Timestamps:
0:00 Introduce the coding challenge
1:07 Introduce the YouTube dataset
3:38 Preload YouTube data
5:30 Debug loading function
8:12 Parse .csv file
9:20 Extract data values
12:48 Mention Leaflet integration
13:55 Describe map types: static and tile
14:38 Create a tile map
15:25 Overlay the map on a canvas
17:38 Add map tiles
18:34 Refine initial map
19:06 Draw a circle with a fixed position
20:10 Draw a circle considering longitude and latitude
21:20 Reference a dataset with the coordinates for the world's countries
22:48 Load country data
23:48 Associate YouTube data by country ID
24:26 Extract longitude and latitude
25:20 Draw a circle with the coordinates
27:27 Show subscriber map
28:15 Update the diameter of the circles
31:12 Examine map update
32:30 Consider the zoom level
34:25 Pre-process YouTube data
36:22 Find the minimum and maximum number of subscribers
37:10 Update drawing logic
39:20 Map diameter considering the minimum and maximum values
40:35 Debug diameter value
42:22 Convert subscriber count to number
43:58 Update scale according to the zoom value
46:28 Load a different dataset
47:24 Highlight the number of views
48:05 Highlight watch times
48:25 Conclude the coding challenge
Editing by Mathieu Blanchette
Animations by Jason Heglund
Music from Epidemic Sound
#datavisualization #worldmap #javascript #p5js
 0:51:07
Coding Challenge #109: Visualizing 500,000 Subscribers
 0:37:05
Coding Challenge #97: The Book of Pi - Part 1
 0:16:03
Coding Challenge #96: Visualizing the Digits of Pi
 0:41:07
Coding Challenge 178: Climate Spiral
 0:34:45
Coding Challenge #48: White House Social Media Data Visualization
 0:30:06
Coding Challenge #143: Quicksort Visualization
 0:00:10
One Million US Dollars | Cash Money
 0:40:37
Coding Challenge #58: 3D Earthquake Data Visualization
 0:18:11
Coding Challenge #97: The Book of Pi - Part 2
 0:06:16
Quantum Manifestation Explained | Dr. Joe Dispenza
 0:00:47
One Piece In 60 Seconds
 0:13:54
Coding Challenge 1: Starfield Simulation
 0:50:00
I Spent 100 Days On A Mercy Unranked To GM
 0:12:41
Coding Challenge #123: Chaos Game Part 1
 0:42:30
Coding Challenge 144: 2D Black Hole Visualization
 0:01:22
Training Visualizations & GPU Usage
 0:27:01
Coding Challenge #49: Photo Mosaic with White House Social Media Images
 0:00:17
This sprocket carries extra water!! #mtb #mountainbike #shorts
 0:00:45
Only flying C-123K Provider almost crashes at Geneseo New York airshow #thunderpig #c123k #save
 0:00:49
Type 1 to 1000 serial numbers easily #excel #shorts #exceltutorial #msexcel #exceltips
 0:38:38
I Survived 100 Days in a COOKIE ONLY WORLD in Hardcore Minecraft
 0:30:09
Coding Challenge #86: Cube Wave by Bees and Bombs
 0:10:01
How I memorised 400 pages of notes in 24 hours using AI (ChatGPT)
 1:18:42
I Ran a Chess Programming Tournament, Here's How it Went!
Комментарии