filmov
tv
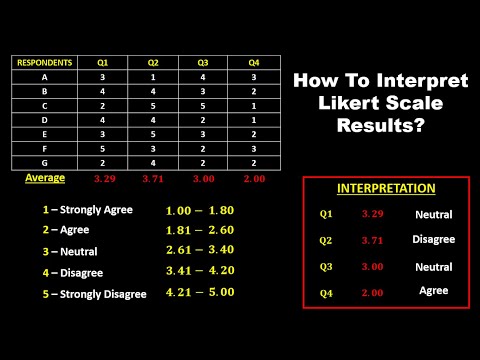
Analyze Likert Scale Data this way as Interval Measure in SPSS

Показать описание
In this video, I have demonstrated how to analyze and interpret Likert Scale Data as Interval or Scale Measure in SPSS, giving full details of the best analytical approaches, such as performing Descriptive Statistics and Independent Sample T- Test as a parametric test statistic, after the condition of normality was shown in two different ways to be satisfied.
The content of this video is detailed and comprehensive, and the demonstration has been simplified to the grassroots and you are hereby advised to see or watch this video to the end and share this video for others to also benefit.
After you have seen this video, you should be able to perform the analysis of your own Likert Scale data in SPSS and interpret it as appropriate.
Below are the Video Links I referred to in this video:
The following are videos in my YouTube Channel. Please, click on the links to see the video of your choice.
Titocan Mark Solutions (TMS) is a YouTube Channel that improves the knowledge of how to do things in many endeavours, Please, encourage education and learning by liking and kindly subscribing to this channel, and so that we begin to send you notifications every time I publish new video content. Thank you.
To Subscribe, Please, click on the red SUBSCRIBE button above or on the video to do so.
![Likert-Scale [Simply Explained]](https://i.ytimg.com/vi/Tf_71r1Ve5w/hqdefault.jpg) 0:05:58
0:05:58
Likert-Scale [Simply Explained]
 0:13:20
The best way to analyze LIKERT SCALE and INTERPRET the results
 0:37:10
Likert Scale Data Analysis and Interpretation of Results
 0:01:00
Converting Likert Scales for analysis
 0:17:37
Analyze Likert Scale Data this way as Ordinal Measure in SPSS
 0:07:45
What tests to use to analyze Likert scale data
 0:07:52
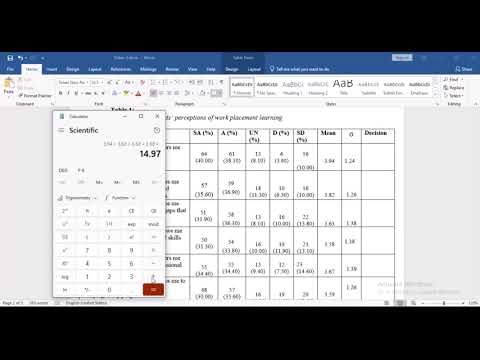
HOW TO INTERPRET LIKERT SCALE RESULTS
 0:08:55
How to analyze Likert Scale and interpret the results
 0:03:54
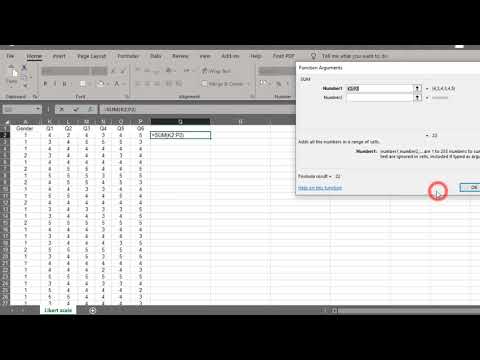
How to analyze Likert Scale using Excel
 0:07:03
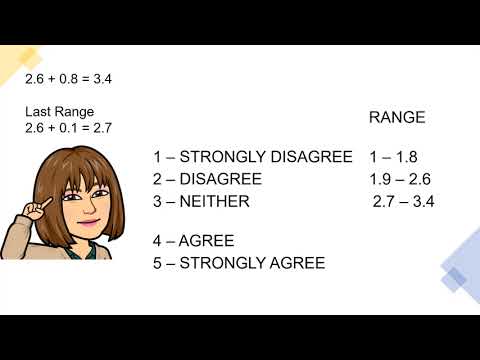
HOW TO INTERPRET THE LIKERT SCALE || 5-POINT LIKERT SCALE
 0:06:04
Analyze and chart Agree/Disagree Likert scale survey data using Pivot Table
 0:16:07
(18E) Analysis of Likert Data
 0:22:42
Analyze Likert Scale Data this way as Interval Measure in SPSS
 0:06:36
THE 5-POINT LIKERT SCALE INTERPRETATION || RESEARCH
 0:10:38
Charting Survey Results in Excel (Visualize Employee Satisfaction results)
 0:10:33
Plotting Likert (agree/disagree) data in Excel
 0:15:19
Likert scale analysis and interpretation for research
 0:17:34
Likert scale data analysis and interpretation
 0:11:17
How to analyze data in Excel for Likert Scale Questions | Create graphs for likert scale questions
 0:14:34
Likert Scale and Its Methods of Analysis-2/ Dr. Abdul Azeez N.P./ NPA Teaching
 0:05:19
How to analyze Likert scale through ANOVA and interpret the results
 0:09:28
How to Analyze Likert Data - Three Ways to Avoid the Likert Crush
 0:12:13
How to analyze Likert Scale through simple linear regression and interpret the results
 0:18:44
Non-Parametric Analysis: An Example Using Likert Data
Комментарии