filmov
tv
Python Quants Tutorial 6 - Portfolio Theory | Refinitiv Developers

Показать описание
It is easy to retrieve historical cross asset data using the Eikon Data API. We show how easy it is to generate statistics for single instruments and for portfolios of instruments. For an example, we use Markovitz’s seminal 1952 paper, ‘Portfolio Selection’ to analyse a portfolio of risky assets using Mean-Variance Portfolio Theory (MVP) and then we derive a minimum volatility portfolio using boundaries and constraints. #Eikon #API #Quant #Python #MachineLearning #DataDevelopers #Refinitiv
- How to retrieve historical data across asset classes via the Eikon Data API
- How to work with such data using Pandas, Plotly and Cufflinks
- Generating statistics for single instruments
- Generating statistics for portfolios
- Simulating portfolio composition
- How to compose and analyze portfolios with regard to their expected return and volatility
- How to construct a Minimum Volatility Portfolio
 0:22:04
Python Quants Tutorial 6 - Portfolio Theory | Refinitiv Developers
 0:15:31
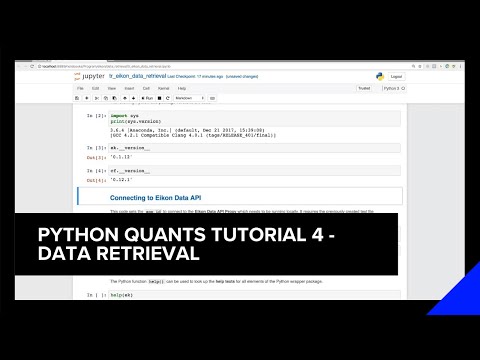
Python Quants Tutorial 4 - Data Retrieval | Refinitiv Developers
 0:23:37
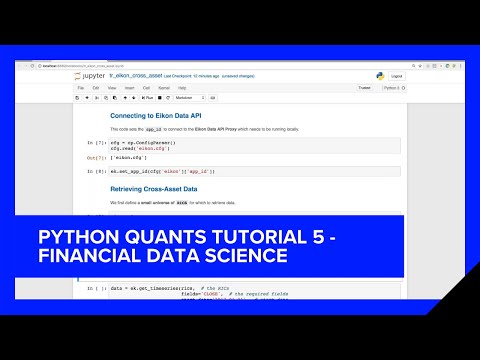
Python Quants Tutorial 5 - Financial Data Science | Refinitiv Developers
 0:20:32
Python Quants Tutorial 8 - Financial Time Series Prediction using Machine | Refinitiv Developers
 0:16:34
Quant Platform by The Python Quants
 0:18:29
Python Quants Tutorial 12 - Derivative Analytics - Calibrating an Opti | Refinitiv Developers
 0:10:23
Python Quants Tutorial 1 - Getting Started on Windows | Refinitiv Developers
 0:00:14
NEWYES Calculator VS Casio calculator
 1:43:21
Build a Trading Bot in Python | Coding Until I Become a Quant
 0:20:17
PYTHON Tutorial Italiano 06 - Lavorare con le Stringhe
 0:00:12
Is Jeff Bezos Really That Approachable #wealth #jeffbezos #celebrity #entrepreneur #ceo
 0:00:37
The Regrets of An Accounting Major @zoeunlimited
 0:05:43
Derivatives Analytics with Python (Wiley Finance) on the Quant Platform
 0:00:20
1st yr. Vs Final yr. MBBS student 🔥🤯#shorts #neet
 1:12:10
Algorithmic Trading in Less Than 100 Lines of Python Code | The AI Machine
 2:59:20
Algorithmic Trading – Machine Learning & Quant Strategies Course with Python
 0:09:01
Quant Finance with Python and Pandas | 50 Concepts you NEED to Know in 9 Minutes | [Getting Started]
 0:00:16
YS Jagan Davos Trolls #ysjagan #appolitics ycp trolls YCPLatestTrolls Latest Shorts
 0:00:28
Developer Last Expression 😂 #shorts #developer #ytshorts #uiux #python #flutterdevelopment
 0:16:53
Installation - Zipline Tutorial local backtesting and finance with Python p.1
 0:09:08
FISH-QUANT video tutorial 6: mature mRNA quantification (batch)
 0:04:19
Python for Algorithmic Trading Course
 0:12:46
Become a DEFI QUANT | Python, Chainlink, and Aave
 0:06:45
Everything you need to know to become a quant trader (in 2024) + sample interview problem
Комментарии