filmov
tv
Chi Square Test in SPSS (Part 1)

Показать описание
How to run a chi square test of independence in SPSS and interpret the output is illustrated in this video.
Chi Square Test
Cross Tabs
Contingency Tables
chi-square test
Pearson Chi-square
SPSS videos statisticsinstructor/Quantitative Specialists:
Video Transcript: In this video we'll examine how to run the chi-square test of independence in SPSS. The chi-square test of Independence measures whether there is a relationship between two categorical variables. And in our example we're going to look at whether there is a relationship between gender and aggressive driving behavior. And what happened in this hypothetical study is we have 200 people, where we have 100 males and 100 females, and then we asked each of these persons through a series of questions on a survey, whether or not they engaged in aggressive driving behavior. So, for example, do they run stoplights, did they tailgate anyone, this sort of thing. And based on the survey responses, they were coded either yes, they engaged in aggressive driving behavior, or no, they did not. So notice here we have our two categorical variables, gender, that's categorical, as it is either male or female, and then aggressive driving behavior is also categorical in this example, as it's either characterized as a yes or no. And once again the chi-square test of Independence measures whether there is a relationship between two categorical variables. So the chi-square test of Independence would be appropriate here, since we have our two categorical variables, gender and aggressive driving behavior. So let's go ahead and take a look at our data here in the Data View window. Notice there's three variables, we have gender, where we have 1s and 2s, and then we have aggressive driving, where we also have 1s and 2s, and then we have our frequency variable, and you saw this in the other chi-square we talked about, the chi-square goodness of fit, where the frequency variable indicates the number of people in a given category. So this 25 means there's 25 people who have a 1 on gender & a 1 on aggressive driving, there are 75 people who have a 1 on gender and a 2 on aggressive driving, and so forth. And we went ahead and we already coded these values into SPSS and I'll show you their values here by clicking on the Variable View tab. And if we go to gender, we can see that 1 is male and 2 is female, and then for aggressive driving, we have 1 is coded as yes, they engaged in aggressive driving, and 2 is no, they did not. So if we go back to our Data View window, and I can click on the Value Labels button up here and you'll see these codes. So we had 25 people who were male and did engage in aggressive driving behavior, whereas we had 75 people who are male who did not engage in aggressive driving behavior. For females, 10 engaged in aggressive driving behavior, and 90 females did not engage in aggressive driving behavior. It's a good idea to take a few moments to make sure that it's clear how to set up the data file for the chi-square test of independence. Notice that we have our 1s and 2s for gender and then we have our 1s and 2s alternated for aggressive driving behavior, and then we have our frequencies. Notice that there's no repeat here of a combination of 1s and 2s. Here we have 1,1 and then we have 1,2 and then 2,1 and then 2,2. And then we have the frequencies for each of these different combinations of 1s and 2s. So the 1s and 2s never repeat the same sequence again. So 1,1 1,2 2,1 2,2, and looking at their actual labels that gives us male aggressive, male not aggressive, female aggressive, female not aggressive. So we want to have all different combinations expressed here in our Data View window. And then the only other thing you need to make sure is that you get the correct frequencies for the category. So we had 25 males who were aggressive, and 75 males who are not aggressive, for example. So in setting up the chi-square test of independence, we have all of our different categories expressed here, and then you just want to make sure you get the correct frequencies in each category. Next we'll go ahead and run our chi-square test of independence and let's use an alpha of .05 here, and the chi square test is naturally a one-tailed test. So to run the chi-square test, because we have our frequency variable here, first we need to weight the cases
 0:05:03
Chi-square test in SPSS + interpretation
 0:05:51
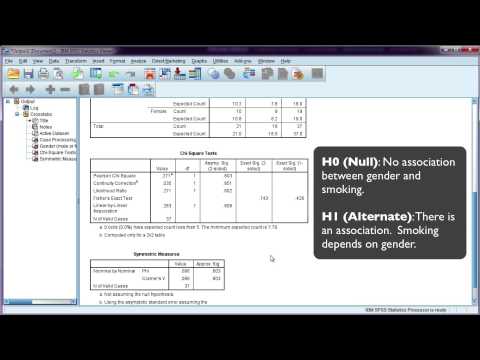
Easy SPSS Tutorial: Chi Square Test in SPSS, Including Interpretation
 0:07:35
Chi-Quadrat-Unabhängigkeitstest in SPSS durchführen - Daten analysieren in SPSS (22)
 0:04:51
Chi Square Test in SPSS (Part 1)
 0:03:38
SPSS (10): Chi-Square Test
 0:10:03
Crosstab Report and Chi Square Test using SPSS
 0:11:53
Chi-Squared Test in SPSS
 0:05:03
Chi-squared test and interpretation using SPSS (assumptions violated)
 0:17:48
Chi-Square in SPSS
 0:02:46
SPSS Video #16: Calculating Chi-square In SPSS
 0:05:02
Chi-square test in SPSS + interpretation (assumptions violated)
 0:02:51
How to run Chi Square Test of Independence in SPSS in 3 MINUTES!!!
 0:05:07
Chi-Square - Post-Hoc Testing - SPSS (Part 1)
 0:09:14
Pearson Chi-Square, Continuity Correction, and Fisher's Exact Test in SPSS
 0:07:07
Chi Square Test of Independence in SPSS - In Depth
 0:05:16
SPSS 24 Tutorial 7: Chi Squared Test
 0:16:01
06. SPSS Classroom | Chi Square test of Independence - Analyze, Interpret, and Report Chi Square
 0:05:53
Chi-Quadrat-Test für Mehrfachantwortsets in SPSS durchführen - Daten analysieren in SPSS (61)
 0:12:42
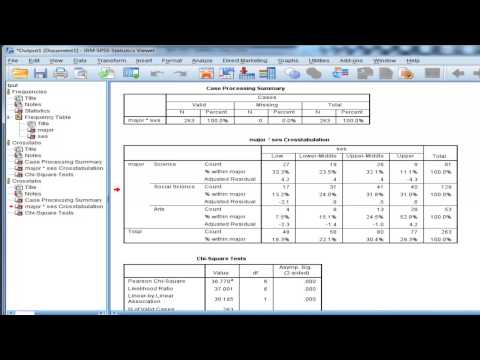
Interpreting Percentages from a Chi-Square Test Crosstabulation Output Table in SPSS
 0:08:48
Chi-Square Test of Independence with Cramer's V in SPSS
 0:36:35
Chi square test of association for 2 X 4 contingency table in SPSS (video 1; May 1 2024)
 0:04:23
Chi Square Test in SPSS (Part 2)
 0:05:04
Chi-Square - Post-Hoc Testing - SPSS (Part 2)
 0:09:15
Chi-Square Test [Simply explained]
Комментарии