filmov
tv
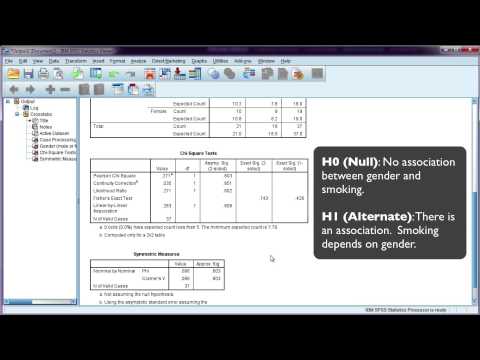
Crosstab Report and Chi Square Test using SPSS

Показать описание
The video guides on how to generate a Crosstab report and perform, interpret and report Chi-Square statistics using SPSS.
For Notes on Crosstab Reports and Chi Square, visit
#ResearchCoach #Crosstab #ChiSquare #ChiSquareTestForIndependence #PearsonChiSquare #ReportingChiSquare #SPSS #SPSSTutorial #SPSSDataAnalysis
For Notes on Crosstab Reports and Chi Square, visit
#ResearchCoach #Crosstab #ChiSquare #ChiSquareTestForIndependence #PearsonChiSquare #ReportingChiSquare #SPSS #SPSSTutorial #SPSSDataAnalysis
 0:10:03
Crosstab Report and Chi Square Test using SPSS
 0:04:32
Stata Tutorial: Cross-tabulation and Chi-squared test
 2:11:42
Crosstab Report and Chi-Square Test Using SPSS
 0:05:03
Chi-square test in SPSS + interpretation
 0:14:59
Cross-Tab & Chi-Square on SPSS
 0:01:59
What is Cross-Tabulation & How to do it? | Contingency or Cross Tabs
 0:10:34
Cross tabulation and Chi Square Analysis in OriginPro
 0:22:02
The Chi-square Statistic and Reporting Results. Part 2 of 2 on Crosstabulations and Chi-square
 0:01:14
Cross Tabulation with chi square
 0:07:50
How to Interpret Crosstabs
 0:10:37
Cross Tabs with SPSS Tutorial (SPSS Tutorial Video #7)
 0:07:53
Chi square test in SPSS - Cross table - Interpretation - Presentation - Hypothesis test
 0:09:15
Chi-Square Test [Simply explained]
 0:06:17
Crosstab Report and Chi Square Test using SPSS Analysis
 0:04:15
Interpreting percentages from a cross tabulation table in SPSS
 0:09:03
Crosstabs And Chi-Square In SPSS
 0:09:11
Crosstabs and Chi Square
 0:06:39
Crosstab Analysis and Chi Square Statistics using BlueSky Statistics
 2:32:16
Cross tab and Chi square
 0:07:48
How to do cross tabulation and chi-square on statistical data in origin
 0:16:01
06. SPSS Classroom | Chi Square test of Independence - Analyze, Interpret, and Report Chi Square
 0:07:22
SPSS Tutorials: Three-Way Cross-Tab and Chi-Square Statistic for Two Categorical Variables
 0:05:03
Chi-squared test and interpretation using SPSS (assumptions violated)
 0:12:42
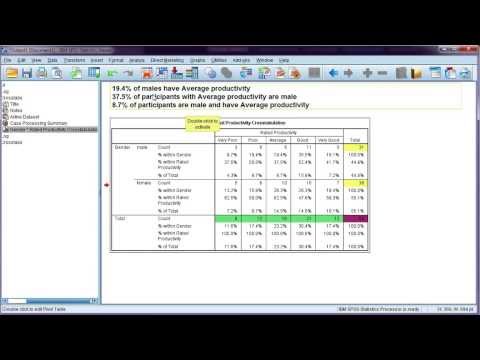
Interpreting Percentages from a Chi-Square Test Crosstabulation Output Table in SPSS
Комментарии