filmov
tv
AP Statistics | 1.1.1 | Analyzing Categorical Data

Показать описание
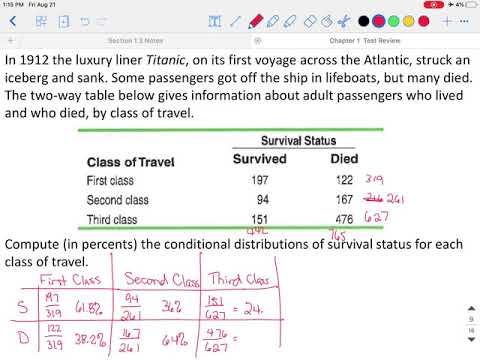
This video covers 1.1 from The Practice of Statistics: What is the difference between categorical (qualitative) data and quantitative data? How to use bar graphs, pie charts, two-way tables to display categorical data. We also cover marginal & conditional distributions. We also introduce the 4-step process (State, Plan, Do, Conclude) for the first time!
****
****
Tired of studying? Did you know I also teach dance? Come take a dance break with me!!!!
****
****
Tired of studying? Did you know I also teach dance? Come take a dance break with me!!!!
 0:02:01
AP Statistics Summarized in UNDER 2 Minutes
 0:51:41
AP Statistics Unit 1 Full Summary Review Video
 0:13:15
AP Stat Exam Review Unit 1
 0:06:47
AP Daily: AP Statistics (1.1)
 0:23:34
AP Statistics Unit 1
 0:00:47
The Most USEFUL AP Classes
 0:08:13
AP Stats 1.1 - Misleading with Data
 0:15:01
AP Statistics | 1.1.1 | Analyzing Categorical Data
 2:05:30
𝟭 𝟭 𝗠 𝗕 𝗣 𝗦
 0:17:53
AP Stats Chapter 1 Test Review
 0:15:00
ap stat unit 1 test review part 1 Questions 1-10
 0:16:53
FRQs Unit 1 AP Stat
 0:16:18
1 | MCQ | Practice Sessions | AP Statistics
 0:49:09
2021 Live Review 1 | AP Statistics | How to Explore and Collect Data
 0:08:40
2021 AP Statistics Free Response #1 (First Administration)
 0:08:23
2023 AP Statistics Free Response #1
 0:11:45
AP Statistics 10-Minute Recap
 0:56:46
Introduction to Statistics
 0:05:03
Introduction to Type I and Type II errors | AP Statistics | Khan Academy
 1:40:53
AP Statistics Full Course
 0:51:03
Standard Normal Distribution Tables, Z Scores, Probability & Empirical Rule - Stats
 0:13:00
What Is Statistics: Crash Course Statistics #1
 0:44:58
AP Statistics - Exam Review #1 - Multiple Choice
 0:13:16
AP Stats Unit 1: Exploring Data - Practice Problems
Комментарии