filmov
tv
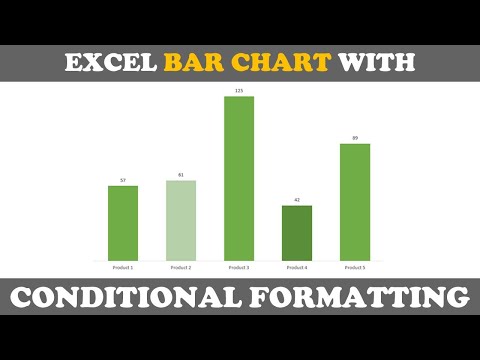
Conditional format column chart in Excel

Показать описание
00:00 Conditional format charts (columns change color based on value)
00:15 Chart data setup- hidden series for each season
01:35 Create the column chart with the conditional formatting
02:00 Hide the unused series in the chart
02:19 Change colors (green for summer, brown for winter)
02:50 Change the data, chart series changes color
03:12 Show years and months as 2 level axis
Make your Excel charts conditional formatted in that the columns change colors depending on what the number or category is, and when the data changes the colors will also change.
 0:05:23
 0:10:23
 0:03:47
 0:12:39
 0:05:56
 0:03:15
 0:12:05
 0:06:55
 1:16:17
 0:01:36
 0:01:46
 0:03:49
 0:09:25
 0:00:46
 0:09:49
 0:05:37
 0:10:19
 0:00:29
 0:12:41
 0:00:39
 0:14:48
 0:06:35
 0:02:43
 0:09:52