filmov
tv
Levels of variation and intraclass correlation

Показать описание
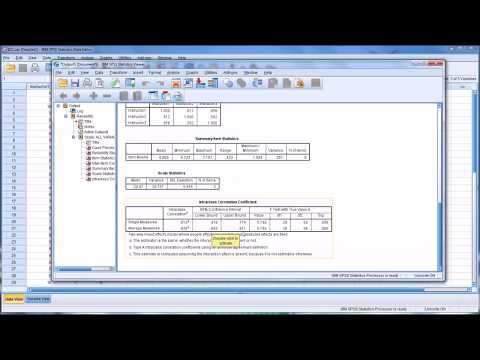
When working with multiple data sets, it is important to analyze the level at which individual observations vary. This can be done by calculating intraclass correlation (ICC) to quantify the variances. Using profitability data as an example, there are three levels of variation that can affect a data set: year-to-year variation within companies, variation between companies, and variation between industries.
In a small data set, graphical analysis can be used to identify patterns, while in larger data sets with manageable numbers of clusters, box plots can be used to understand between and within variances. The ICC(1) is calculated as the variance between groups divided by the total variance, helping to determine how much of the variation in the data is attributed to the groups and how much is within the groups. ICC(1) values close to 0 indicate no meaningful clustering, and values close to 1 indicate no variance within clusters. In cases where ICC(1) is around 0.5, multi-level modeling may be needed to account for the levels in the analysis.
In a small data set, graphical analysis can be used to identify patterns, while in larger data sets with manageable numbers of clusters, box plots can be used to understand between and within variances. The ICC(1) is calculated as the variance between groups divided by the total variance, helping to determine how much of the variation in the data is attributed to the groups and how much is within the groups. ICC(1) values close to 0 indicate no meaningful clustering, and values close to 1 indicate no variance within clusters. In cases where ICC(1) is around 0.5, multi-level modeling may be needed to account for the levels in the analysis.
 0:10:25
Levels of variation and intraclass correlation
 0:08:08
Determining Inter-Rater Reliability with the Intraclass Correlation Coefficient in SPSS
 0:10:27
Multilevel modeling using SPSS (July, 2019)
 0:03:51
Intraclass Correlation ICC
 0:07:31
Intraclass Correlations
 0:14:04
Intraclass Correlation 2
 0:16:24
Calculating ICC for logistic multilevel analysis
 0:08:12
Intraclass Reliability
 0:20:57
Building and Comparing Mixed Models in R: ICC, Bayes Factor, and Variance Explained
 0:33:15
Three-level multilevel modeling using SPSS 28 (March 2022)
 0:02:08
Intraclass correlation
 0:10:40
Selecting Raters using the Intraclass Correlation Coefficient in SPSS
 0:11:07
Intraclass Correlation in Mplus
 0:22:41
SPSS Tutorial: Inter and Intra rater reliability (Cohen's Kappa, ICC)
 0:17:24
ICC/DEFF/CVw - R Demonstration
 0:07:16
R Tutorial: Test-retest reliability (using intraclass correlation)
 0:08:26
JASP 0.17 Tutorial: Intraclass Correlation [ICC] Analysis (Episode 47)
 0:01:13
StatHand - Interpreting an intraclass correlation coefficient for test-retest reliability in SPSS
 0:07:38
Intraklassenkorrelationskoeffizient in R berechnen - Daten analysieren in R (56)
 0:05:22
Using Excel to calculate a correlation coefficient || interpret relationship between variables
 0:37:12
Multilevel regression with 2 levels in SPSS: Review of examples from Chapter 3 of Heck et al. (2014)
 0:00:32
Intraclass correlation: optimal sample size with confidence intervals/2-way mixed factorial design
 0:11:38
IntraClass Correlation Coefficient
 0:01:10
StatHand - Interpreting an intraclass correlation coefficient for inter-rater reliability in SPSS
Комментарии