filmov
tv
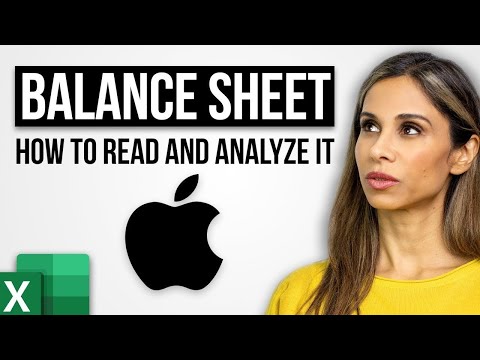
How to read the Balance Sheet of Company | Understanding Stock Market Basics | BALANCE SHEET

Показать описание
How to Analyze Balance Sheet of a Company this method is still used by Warren Buffet and Peter Lynch.
I Learned from Buffet and Lynch and I always come across some promising companies, but before diving in, I knew I had to analyze their financial health using key ratios. in the video you will see example I learned from peter lynch for a latest example please check the description.
Step 1: Liquidity Ratios
I started with liquidity ratios, which tell me if a company can meet its short-term obligations. The first one I looked at was the Current Ratio.
Current Ratio = Current Assets / Current Liabilities
For example, let’s say I was considering investing in a tech startup called “InnoTech.” Their balance sheet showed current assets of $5 million and current liabilities of $3 million.
Current Ratio = $5 million / $3 million = 1.67
This indicates InnoTech could cover its short-term debts comfortably. A ratio above 1 is generally favorable.
Next, I checked the Quick Ratio, which excludes inventory from current assets.
Quick Ratio = (Current Assets - Inventory) / Current Liabilities
If InnoTech had $1 million in inventory, the calculation would be:
Quick Ratio = ($5 million - $1 million) / $3 million = 1.33
Again, this is a good sign, showing that even without selling inventory, InnoTech can meet its short-term obligations.
Step 2: Profitability Ratios
Next, I turned to profitability ratios to assess how well InnoTech was generating profit.
Net Profit Margin = Net Income / Revenue
Let’s say InnoTech reported a net income of $1 million on revenues of $10 million.
Net Profit Margin = $1 million / $10 million = 10%
A higher net profit margin indicates better efficiency in turning revenue into actual profit.
Return on Equity (ROE) = Net Income / Shareholders' Equity
If InnoTech had shareholders' equity of $5 million:
ROE = $1 million / $5 million = 20%
This suggests that the company is effectively using shareholders' funds to generate profits—a key indicator of financial health.
Step 3: Debt Ratios
I then examined InnoTech's debt levels to understand its financial leverage.
Debt-to-Equity Ratio = Total Liabilities / Shareholders' Equity
If InnoTech had total liabilities of $2 million:
Debt-to-Equity Ratio = $2 million / $5 million = 0.4
This low ratio indicates that the company is not overly reliant on debt, which is reassuring for long-term stability.
Step 4: Efficiency Ratios
Next up were efficiency ratios. These help me understand how well a company utilizes its assets.
Inventory Turnover = Cost of Goods Sold / Average Inventory
If InnoTech’s cost of goods sold was $4 million and average inventory was $1 million:
Inventory Turnover = $4 million / $1 million = 4
This means they sold their inventory four times during the year—an indication of good sales momentum.
Step 5: Valuation Ratios
Finally, I looked at valuation ratios to determine if the stock was fairly priced.
Price-to-Earnings (P/E) Ratio = Stock Price / Earnings Per Share (EPS)
If InnoTech’s stock price was $20 and EPS was $2:
P/E Ratio = $20 / $2 = 10
A lower P/E ratio might indicate that the stock is undervalued compared to its earnings potential.
Step 6: Putting It All Together
As I sat back with my coffee, I realized that these ratios provided a comprehensive view of InnoTech's financial health. They helped me assess liquidity, profitability, efficiency, and valuation—all crucial factors for making informed investment decisions.
By applying Lynch's principles and focusing on these key financial ratios, I felt confident in my ability to identify promising investment opportunities. This approach not only gave me clarity but also empowered me as a young investor navigating the complex world of finance.
Investing isn't just about numbers; it's about understanding the story behind those numbers. With each analysis, I'm not just looking for stocks; I'm uncovering potential success stories waiting to unfold. And that's what makes this journey so exciting!
#learningstocks, #riskrewards, #riskandreward, #tradeanalysis, #tradesetup, #morningmarket, #rsiindicator, #equitytraders, #graphs, #howtoinvestinstocks, #targetachieved, #tradingforbeginners, #priceactiontrading, #bankniftyexpert, #movingaverage
 0:16:19
 0:15:36
 0:05:36
 0:21:32
 0:08:27
 0:04:49
 0:08:08
 0:01:55
 0:00:12
 0:09:30
 0:14:26
 1:19:15
 0:15:04
 0:06:59
 0:14:34
 0:09:10
 0:00:26
 0:04:44
 0:07:44
 1:11:23
 0:00:56
 0:09:21
 0:10:04
 0:14:17