filmov
tv
Bar & Pie Chart in QGIS || Data Representation in Bar & Pie-Chart on QGIS 3.14 || IT GIS

Показать описание
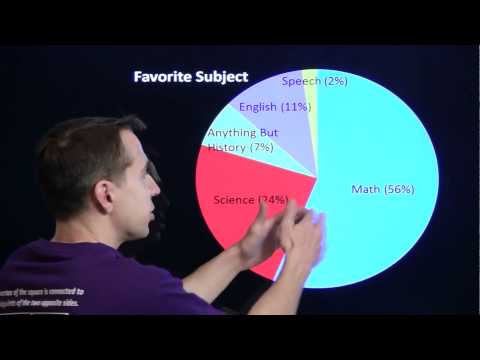
In this video, I'm covering Data representation in Bar and Pie-Chart on QGIS 3.14.
After joining the attribute table on shapefile you can represent the data on Bar or Pie daigram.
---------------------------------------------------
For other videos on my channel:
+++++++++++++++++++++++++
QGIS Video Tutorials:
1. How to Download and Install the Latest Version of QGIS
2. GCP to Image Geo-referencing in QGIS
3. Image to Image Geo-referencing in QGIS
4. Digitization in point, line, and Polygon in QGIS
5. Advance Digitization Technique and Calculate Area in QGIS
6. Join Attribute Table in QGIS
7. Data Exploration Using QGIS 3.18
8. Spatial Query in QGIS
9. Attribute Query in QGIS 3.18
10. Data Representation in Bar & Pie-Chart on QGIS
11. How to Prepare Choropleth Map in QGIS
12. Map Preparation and Map Composition in QGIS
13. Layer Stack or Marge in QGIS
14. Merge and Clip in QGIS 3.14
15. How to Install Plugins in QGIS || Install Semi-automatic Classification Plugin
16. Supervised Image Classification in QGIS
17. Digitization on Google Earth
18. Export to KML in QGIS 3.16
Download and Installation:
1. Download Topographic Map from Survey of India
2. Download Satellite Images from USGS For Free
3. Download LISS-III & DEM Image from Bhuvan
ArcGIS Video Tutorials:
1. How to Convert KML File into Shapefile
2. How to Assign Projection in ArcGIS
3. How to Clip in ArcGIS
4. How to Add a Google Earth Extension in ArcGIS || Export to KML Extension
5. Assign a Shortcut Key in ArcGIS
6. Split Features in ArcGIS
7. Split by Attribute in ArcGIS
ERDAS IMAGINE Video Tutorials
1. Layer Stacking in ERDAS Imagine 14
2. Subset in ERDAS Imagine
----------------------------------------------------------------------------
#ITGIS #Bar&Pie-Chart #QGIS
----------------------------------------------------------------------------
If you have any queries please comment below.
If you like my videos please subscribe to my channel for the latest update.
Don't forget to Like, Share or Comment.
Thanks for watching it.
 0:02:55
HOW TO | Create a Pie Graph with Pie Graph Explosion in Excel
 0:03:16
How to Make a Pie Chart in Excel
 0:07:36
Bar Chart, Pie Chart, Frequency Tables | Statistics Tutorial | MarinStatsLectures
 0:10:07
Bar of Pie Chart in Excel
 0:13:31
How to Make a Pie Chart in Excel
 0:07:35
Bar Charts, Pie Charts, Histograms, Stemplots, Timeplots (1.2)
 0:23:36
IELTS Writing Task 1: Ace Pie Charts in Minutes
 0:05:13
How To Create A Pie Chart In Excel (With Percentages)
 0:18:55
Matplotlib for Beginners (Part 2): Creating Bar, Pie, and Scatter Charts with Real-Life Data Python
 0:04:43
Create a Pie of Pie Chart to Show Details Within a Data Value
 0:00:54
4.1 - Bar Chart vs Pie Chart
 0:08:09
Art of Problem Solving: Bar Charts and Pie Charts
 0:01:59
How to make a 2D Bar of Pie Chart in Excel 2016
 0:00:20
Create a pie chart in Google Sheets
 0:04:51
Bar Charts and Pie Charts in R | R Tutorial 2.1 | MarinStatsLectures
 0:10:43
How to Create a Bar of Pie Chart in Excel | Create a Bar of a Pie Chart | Bar of Pie Chart in Excel
 0:01:03
Bar of Pie Chart - Label Options
 0:12:49
Making Bar Graphs and Pie Charts
 0:05:13
How To Choose The Right Graph (Types of Graphs and When To Use Them)
 0:11:37
Excel Charts: Sorted Bar Chart as Alternative to the Pie Chart
 0:08:56
MS Excel - Pie, Bar, Column & Line Chart
 0:02:13
Bar Graphs and Pie Charts
 0:00:28
How to make a pie chart in Google Sheets! 🥧 #googlesheets #spreadsheet #excel #exceltips
 0:05:24
Enhanced Bar Chart: A Better Alternative to PIE Chart in Power BI
Комментарии