filmov
tv
Build an Interactive Finance Dashboard with Python & Streamlit to compare Fundamentals of Stocks

Показать описание
In this video we are creating an interactive Finance Dashboard showing the fundamentals of stocks in a certain peer group based on their sector. We are checking the Dow Jones Industrial Average for e.g. Price Earnings ratios or dividend yield but as said this is extendable based on your requirements.
This whole implementation is in Python using the streamlit library.
If you found this video interesting or helpful please consider subscribing. Thank you very much in advance!
Get the Notebook/Source code by becoming a Tier-2 Channel member:
To make this Dashboard even better you should update the Database regularly. I have resources on how to do that on my channel as well.
In the beginning I stated IBM pays the highest dividend and Apple pays the lowest dividend. This statement has to be understood in a relative context. I am referring to the yield and not the absolute amount.
Video on streamlit:
Video on fundamental analysis of stocks with Python:
Video on Python and SQL:
Link to wikipedia table:
Disclaimer: This video is not an investment advice and is for educational and/or entertainment purposes only!
0:00 - 01:24 How the Dashboard is working and prerequisites
01:24 - 08:02 Getting fundamentals and store them in a SQL DataBase
08:02 - 12:36 Creating the Streamlit Dashboard
#Python #Streamlit #Fundamentals
 0:41:58
Interactive Personal Finance Dashboard with FREE EXCEL TEMPLATE
 0:19:21
📊 How to Build Excel Interactive Dashboards
 0:30:37
How to build Dynamic & Interactive Dashboard in EXCEL with Pivot Tables&Charts | Tutorial Ep...
 0:19:41
Make an Interactive Excel Dashboard in 4 Simple Steps!
 0:12:55
Create a Personal Financial Dashboard with Microsoft Excel
 0:40:32
Create interactive excel dashboard in 5 simple steps #exceldashboard #exceltutorial #pivottable
 0:25:43
How to build Dynamic & Interactive Dashboard in EXCEL without VBA | Full Tutorial + Voice-over
 0:13:20
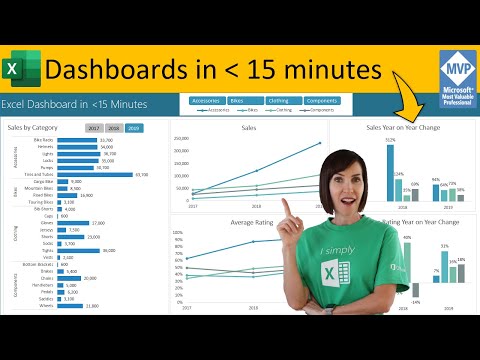
Secrets to Building Excel Dashboards in Under 15 Minutes & UPDATES with 1 CLICK!
 2:12:41
Tableau Awareness (07-07-2024)
 0:35:28
Easy Build Budget vs Actual Dashboard + FREE File Download
 0:33:20
ULTIMATE Personal Budget & Interactive Dashboard in Excel (FREE Template)
 0:06:09
4 x AI Dashboard Designs in 60 SECONDS!
 0:01:04
I Create Dashboard in One Minute using Python | Python for beginners | #python #coding #programming
 1:14:30
Is This Microsoft Excel?! Financial Statistics Dashboards System | Tutorial 1
 0:28:10
Animated Excel Dashboard !! Personal Finance Tracker
 0:12:36
Build an Interactive Finance Dashboard with Python & Streamlit to compare Fundamentals of Stocks
 0:41:23
Interactive Dashboard Step by Step + FREE File Download
 0:22:23
Create an Excel Dashboard to Easily Track Budget and Actuals with Variances
 5:23:38
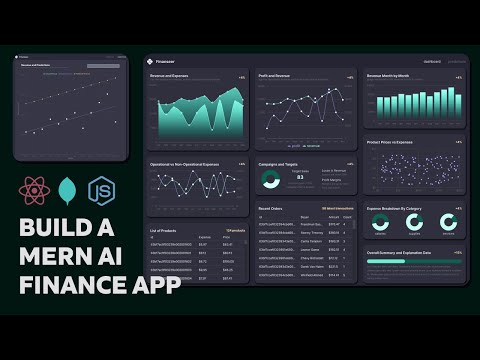
Build A MERN Finance Dashboard App | Machine Learning, Typescript, React, Node, MUI, Deployment
 0:59:45
Personal Financial Dashboard Created with Power BI
 2:00:03
Interactive Insights: Excel Dashboard Techniques. How to create Excel Dashboard
 0:27:06
Build Your Own Financial Dashboard with Python
 0:22:13
Make an Incredible Finance KPI Dashboard with Power BI in 20 minutes
 0:26:39
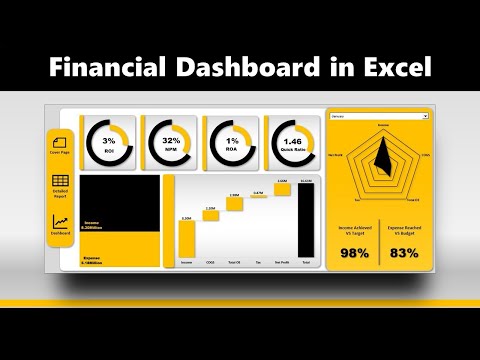
Financial Dashboard in Excel
Комментарии