filmov
tv
How to Calculate and Interpret R Square in SPSS; Regression; Correlation

Показать описание
In this video we take a look at how to calculate and interpret R square in SPSS. R square indicates the amount of variance in the dependent variable that is accounted for or explained by the independent variable.
Video Transcript: In this video I want to show you how to calculate R squared. Now here I have an example with three variables. If I'm trying to find R squared for just two variables, one way we can go about doing that is just running a correlation. Let me show you what I mean here. So if I go to analyze and then correlate and then bivariate let's say we want R square between SAT and college GPA, so I'll move those two over and then I'll click OK. Now this gives me not R squared but it gives me r so the correlation between SAT and college GPA is .65 and that is in fact significant at the .01 level. Now that's r; so if I want R squared what I can do is just simply square that. So .65 and then squared here is point .4225 so R squared here is .42. Now another way to do this is that if I have more than two variables that I'm working with, or if I just don't feel like calculating R squared manually by squaring r, what I can do is I can go to analyze and then regression and select linear. Now I have to decide here what my dependent variable is, or what it is that I'm trying to predict. Now SAT was measured in high school and college GPA, as the variable sounds, is GPA in college during the first year, after one year college. So it makes sense that SAT would predict college GPA. So we'll put the thing we're trying to predict in the dependent box and then we'll put SAT and the independent. OK let's go ahead and click OK. Now if you recall from our earlier analysis, when we squared that correlation we got .4225. So R square was .4225. And here to find R squared we want to go to the Model Summary table and here's r this is the correlation .65, we saw that in our previous analysis. And then R squared is right next to r, notice .422. And that's exactly what we got before within rounding error. So we can run regression to calculate R squared. Now in case you're not familiar with what R squared is, it indicates the amount of variance in the dependent variable that is accounted for or explained by the independent variable. So since we're using SAT here to predict college GPA, What that means is. If we know a person's SAT score, we can account for I can convert this to a percentage, about 42% of the variance in college GPA, which is pretty good. OK so that's what R squared means, it's a measure of how much we explained in one variable using one or more other variables. And one last thing here, if you want to calculate R squared and you have more than two variables at once, then you really need to use this regression approach here to find that. So let's say we want to use both SAT and social support to predict college GPA and we're doing this two try and get our R square. So we're doing this to try and see how well, overall, these two predictors combined how much of college GPA they account for or explain, which you may recall is what R square really means. How much of the variance did we account for in a given variable using one or more other variables. So go ahead and click OK. And then here notice our R squared increased, and it will when we add another predictor in almost all cases. And here our R squared is .511. So using social support and SAT we can account for about 51% of the variance in college. So the GPA in college after their first year. OK that's it. Thanks for watching.
Video Transcript: In this video I want to show you how to calculate R squared. Now here I have an example with three variables. If I'm trying to find R squared for just two variables, one way we can go about doing that is just running a correlation. Let me show you what I mean here. So if I go to analyze and then correlate and then bivariate let's say we want R square between SAT and college GPA, so I'll move those two over and then I'll click OK. Now this gives me not R squared but it gives me r so the correlation between SAT and college GPA is .65 and that is in fact significant at the .01 level. Now that's r; so if I want R squared what I can do is just simply square that. So .65 and then squared here is point .4225 so R squared here is .42. Now another way to do this is that if I have more than two variables that I'm working with, or if I just don't feel like calculating R squared manually by squaring r, what I can do is I can go to analyze and then regression and select linear. Now I have to decide here what my dependent variable is, or what it is that I'm trying to predict. Now SAT was measured in high school and college GPA, as the variable sounds, is GPA in college during the first year, after one year college. So it makes sense that SAT would predict college GPA. So we'll put the thing we're trying to predict in the dependent box and then we'll put SAT and the independent. OK let's go ahead and click OK. Now if you recall from our earlier analysis, when we squared that correlation we got .4225. So R square was .4225. And here to find R squared we want to go to the Model Summary table and here's r this is the correlation .65, we saw that in our previous analysis. And then R squared is right next to r, notice .422. And that's exactly what we got before within rounding error. So we can run regression to calculate R squared. Now in case you're not familiar with what R squared is, it indicates the amount of variance in the dependent variable that is accounted for or explained by the independent variable. So since we're using SAT here to predict college GPA, What that means is. If we know a person's SAT score, we can account for I can convert this to a percentage, about 42% of the variance in college GPA, which is pretty good. OK so that's what R squared means, it's a measure of how much we explained in one variable using one or more other variables. And one last thing here, if you want to calculate R squared and you have more than two variables at once, then you really need to use this regression approach here to find that. So let's say we want to use both SAT and social support to predict college GPA and we're doing this two try and get our R square. So we're doing this to try and see how well, overall, these two predictors combined how much of college GPA they account for or explain, which you may recall is what R square really means. How much of the variance did we account for in a given variable using one or more other variables. So go ahead and click OK. And then here notice our R squared increased, and it will when we add another predictor in almost all cases. And here our R squared is .511. So using social support and SAT we can account for about 51% of the variance in college. So the GPA in college after their first year. OK that's it. Thanks for watching.
 0:10:41
NCCMT - URE - Relative Risk it’s easy to calculate and interpret
 0:11:00
How to Interpret and Use a Relative Risk and an Odds Ratio
 0:11:21
p-values: What they are and how to interpret them
 0:09:16
How to Calculate and Interpret a Correlation (Pearson's r)
 0:06:06
Sensitivity and Specificity simplified
 0:07:39
Know how to interpret an epidemic curve?
 0:11:04
Math Antics - Mean, Median and Mode
 0:07:10
Paired Samples T-Test (How to calculate and interpret)
 0:40:33
AQA A Level Psychology | Live Revision | Data Skills
 0:10:11
Student's t-test
 0:07:49
Standard deviation (simply explained)
 0:07:06
How to Interpret RBC Indices (e.g. hemoglobin vs. hematocrit, MCV, RDW)
 0:18:33
How to interpret an ECG systematically | EXPLAINED CLEARLY!
 0:01:44
Math Dude 023 • Video Extra! • How to Calculate and Interpret Median Values
 0:12:57
Correlation Coefficient
 0:07:14
How To Calculate The Standard Deviation
 0:01:44
How to Calculate and Interpret Median Values with Math Dude, Jason Marshall
 0:05:22
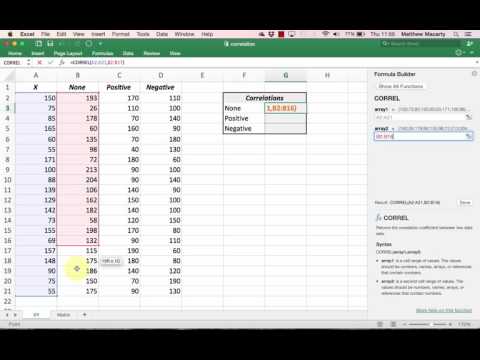
Using Excel to calculate a correlation coefficient || interpret relationship between variables
 0:05:02
Interpret an Arterial Blood gas report in 4 steps
 0:04:41
Understanding Ankle Brachial Pressure Index (ABPI) in Peripheral Vascular Disease
 0:15:57
PROCESS CAPABILITY: Explaining Cp, Cpk, Pp, Ppk and HOW TO INTERPRET THOSE RESULTS
 0:03:04
How to Interpret the Results of an ABG?
 0:10:09
Relative risk - how to calculate and interpret | 95% CI
 0:04:20
How to Calculate and Interpret R Square in SPSS; Regression; Correlation
Комментарии